
By Jim Bonham and Sean Corbett
1 Abstract
The complexity of superannuation and the age pension conceals at least 6 time-bombs – slowly evolving automatic changes to the detriment of retirees – caused by inconsistent indexation: Division 293 tax, currently only for high income earners, will become mainstream.Shrinking of the transfer balance cap relative to the average wage (which is a measure of community living standards) will reduce the relative value of allocated pensions.Shrinking of the transfer balance cap, relative to wages, will increase taxation on superannuation in retirement. Prohibiting non-concessional contributions when the total superannuation balance exceeds the transfer balance cap will constrict superannuation balances more over time.The age pension will become less accessible, as the upper asset threshold shrinks relative to wages.Part age pensions, for a given value of assets relative to wages, will reduce.
2 Introduction
The Terms of Reference of the Review of the Retirement Income System require it to establish a fact base of the current retirement income system that will improve understanding of its operations and outcomes.
Important goals are to achieve adequate retirement incomes, fiscal sustainability and appropriate incentive for self-provision. The Retirement Income System Review will identify:
- “how the retirement income system supports Australians in retirement;”
- “the role of each pillar [the means-tested age pension, compulsory superannuation and voluntary savings, including home ownership] in supporting Australians through retirement;”
- “distributional impacts across the population over time; and”
- “the impact of current policy settings on public finances.”
For the detailed Terms of Reference follow the link at https://joshfrydenberg.com.au/latest-news/review-of-the-retirement-income-system/.
Terrence O’Brien and Jack Hammond have made a number of suggestions for the Review to consider (https://saveoursuper.org.au/save-our-super-suggestions-for-review-of-retirement-income-system/). In particular, at the close of their paper they wrote:
“9. Let the modelling speak
“Only long-term modelling can show which measures are likely to have the best payoffs in greatest retirement income improvements at least budget cost. Choice of which measures to develop further are matters for judgement, balancing the possible downside that extensive policy change outside a superannuation charter may only further damage trust in retirement income policy setting and in Government credibility. “
This paper expands on that point, by presenting the results of straightforward but informative modelling which shows how the age pension, superannuation and voluntary savings (including home ownership) operate and interact – particularly over extended time periods.
A disturbing problem, because it is not obvious, arises from the inappropriate, or no, indexation of various parameters within both the superannuation system and the age pension system. This was briefly mentioned by Sean Corbett (https://www.superguide.com.au/retirement-planning/politician-greed-destroying-super), but has otherwise gained little or no attention.
Over the medium to long term, this inappropriate indexation will result in higher taxation, reduced age pension and superannuation for many people and a generally worse retirement outcome. If this is the deliberate intent of the government, it should be declared. Otherwise the problem should be corrected.
These indexation issues are the retiree time-bombs. The Review must come to grips with them, whether or not they are intentional, and they are the focus of this paper.
3 The importance of the average wage
The impact of superannuation on an individual typically extends from the first job, through retirement to death; or perhaps even further until the death of a partner or another dependent. For many, the age pension provides critical income through all or part of their retirement.
Accordingly, formal analysis of retirement funding often must extend over many decades, making suitable indexation an extremely important matter.
The full age pension is indexed to the Consumer Price Index (CPI) or the Pensioner and Beneficiary Living Cost Index, or to Male Total Average Weekly Earnings (MTAWE) if that is higher, which it usually is. In May 2019 MTAWE was $1,475.60 per week or approximately $76,730 per annum.
This method of indexing is intended to allow retirees receiving a full age pension to maintain their living standard relative to that of the general community – MTAWE being taken as an indicator of that standard – and it is critical to the design of the full age pension.
For long term modelling ASIC’s Money Smart superannuation calculator suggests a combination of 2% for CPI inflation, plus 1.2% for rising living standards, giving an inflation index of 3.2% (https://www.moneysmart.gov.au/tools-and-resources/calculators-and-apps/superannuation-calculator). In this paper, that figure of 3.2% is assumed to represent future wages growth.
This is a modelling exercise, not a prediction, so the precise value of wages growth assumed in this paper is not particularly important – use of a somewhat different figure would only change details, not the big picture – but the distinction between CPI growth and wages growth is important, the latter usually being higher.
4 Division 293 tax
Division 293 tax (see https://www.ato.gov.au/Individuals/Super/In-detail/Growing-your-super/Division-293-tax—information-for-individuals/) is a good place to begin this analysis because the problem is straightforward.
Division 293 tax has the effect of increasing the superannuation contributions tax for high income earners. The details don’t matter here, as we are only concerned with the threshold: $300,000 when the tax was introduced in 2012, subsequently reduced to $250,000 in 2017.
During this period the average wage has been rising steadily, which means the reach of this tax is extending further and further down the income distribution. Eventually, if the threshold is not increased, it must reach the average wage, by which time Division 293 will have become a mainstream tax.
Fig 1 shows the actual and projected values (in nominal dollars) of the tax threshold and of the average wage. The two are projected to be roughly equal within about 30 years.
If Labor had been successful in the 2019 election, the Division 293 threshold would have been further reduced to $200,000 so that, barring further changes, it would have been equal to the average wage in about 25 years.

Fig 2 shows the same data replotted by dividing the Division 293 threshold for each year by the average wage for that year and expressing the result as a percentage. Expressing data relative to the average wage in each year, as in Fig 2, is often an informative way to show long term trends.
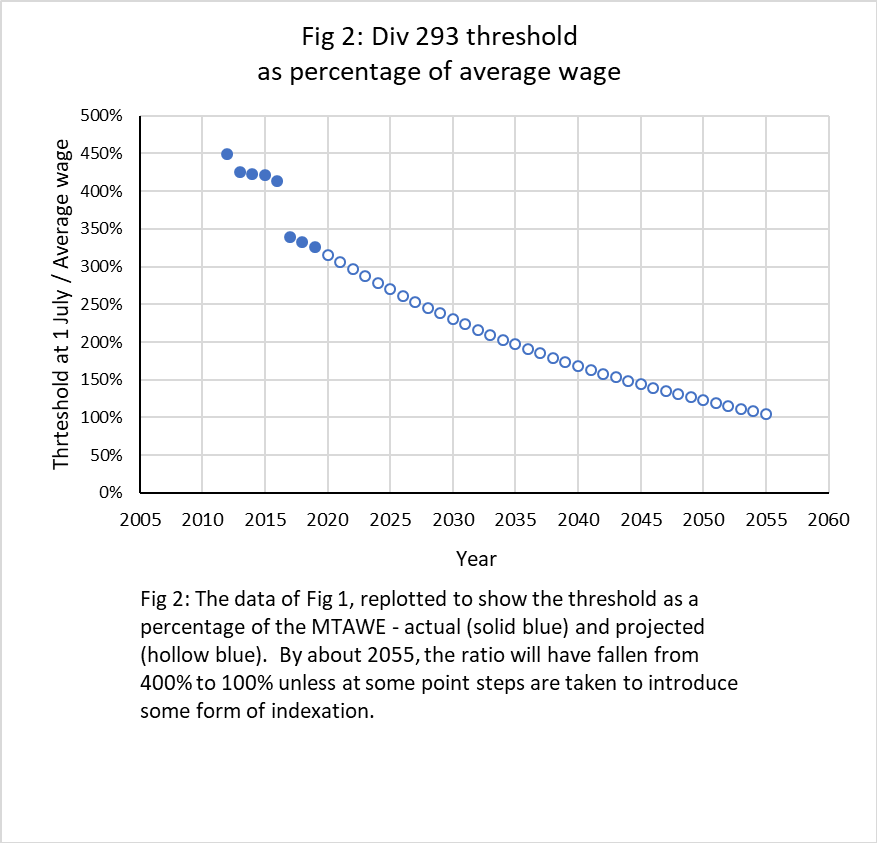
If the Division 293 threshold remains unchanged in nominal dollars, it will continue to decrease relative to the average wage, and so a greater percentage of taxpayers will be caught each year. They will find their after-tax superannuation contributions, and hence their balance at retirement, will decrease as will their subsequent retirement income from superannuation.
This will reduce the effectiveness of superannuation as a long-term savings mechanism. People’s confidence in superannuation will be eroded, as it thus becomes less effective.
Failure to index the Division 293 threshold to wages growth (which would confine its effect to the same small percentage of high wage earners in future years) is taxation by stealth and makes it the 1st time-bomb.
The very simple solution is for the government to commit to indexing the Division 293 threshold in line with wages growth.
5 The transfer balance cap
5.1 The value of allocated pensions
The transfer balance cap, currently $1.6 million, is the maximum amount with which one can start a tax-free allocated pension in retirement. Any additional superannuation money must either be withdrawn or left in an accumulation account where taxable income is taxed at 15%.
Unlike the Division 293 threshold the transfer balance cap is indexed, but it is indexed to CPI inflation (assumed to be 2% in this paper) rather than to wages (3.2%), and adjustments are only made in $100,000 increments.
Indexing the transfer balance cap to CPI means that over time the starting value of an allocated pension account will become lower relative to the average wage, because the latter rises faster.
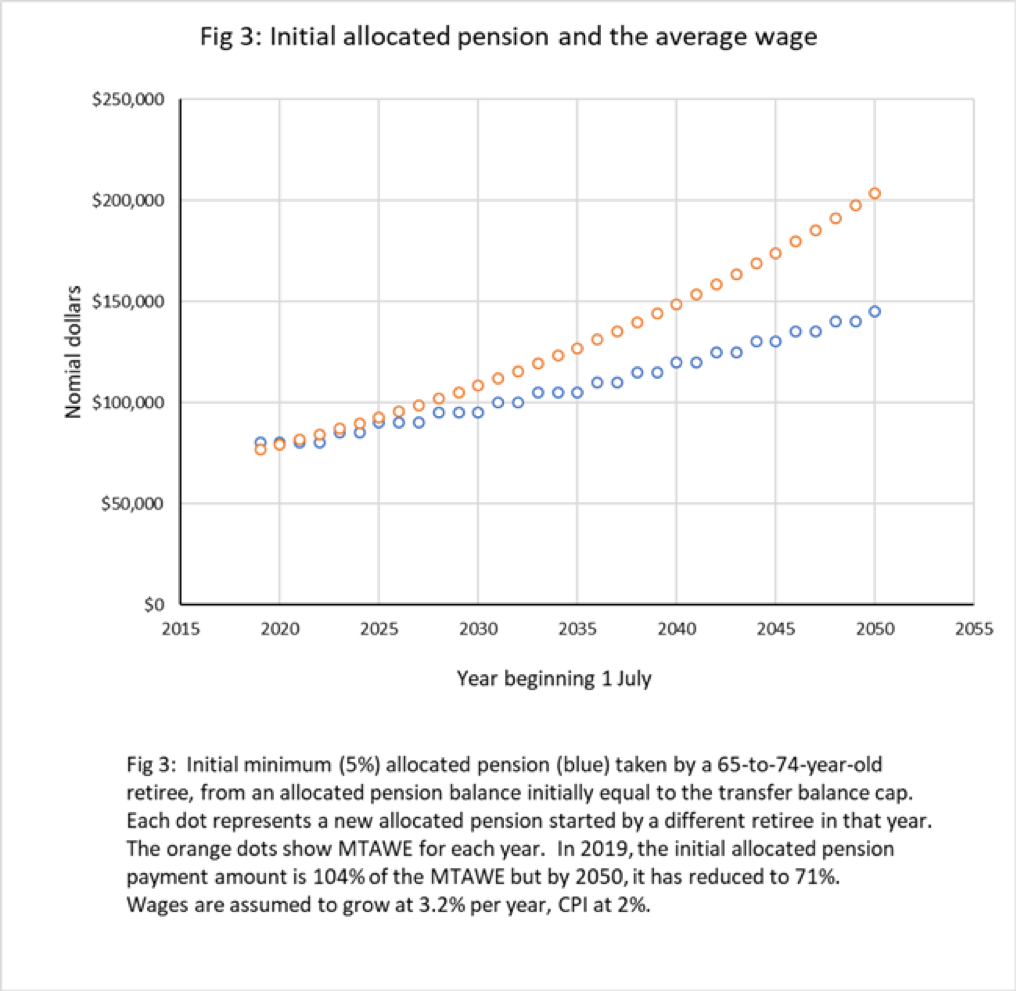
This is illustrated in Fig 3, where projected values of MTAWE are shown in orange; and the minimum (5%) allocated pension drawn by someone starting retirement at age 65-74, with an allocated pension account balance equal to the transfer balance cap, is shown in blue.
Despite the fact that the minimum allocated pension payment amount increases every couple of years, the average wage increases faster.
The following table shows some of the data behind Fig 3, for someone age 65 to 74 retiring in 2019, compared to retirement in 2050:
| Year | Transfer Balance Cap | Allocated Pension (AP) | MTAWE | Ratio AP/MTAWE |
| 2019 | $1.6 m | $80,000 | $76,730 | 104% |
| 2050 | $2.9 m | $145,000 | $203,724 | 71% |
This is a big drop in relative living standard for superannuants: 104% of MTAWE in 2019 down to 71% in 2050.
This degradation, relative to community living standards, of the allocated pension provided by the transfer balance cap is the 2nd time-bomb for the transfer balance cap.
5.2 Taxing super in retirement
Because the transfer balance cap will grow more slowly than wages, one expects that in the future an increasing proportion of a retiree’s superannuation will be held in taxable accumulation accounts rather than in tax-free allocated pension accounts.
This is another instance of taxation by stealth. It is the 3rd time-bomb.
5.3 Non-concessional contributions
Non-concessional contributions (from post-income-tax money) are currently limited to $100,000 per annum. That limit is indexed to wages growth, like the $25,000 limit on concessional (pre-tax) contributions.
However, non-concessional contributions are only permitted when the total superannuation balance is less than the transfer balance cap which, as we have seen, is indexed to CPI. The effect of this indexation mismatch is that the ability to make non-concessional contributions will automatically shrink, relative to wages and living standards, in the future. Those who rely on substantial non-concessional contributions late in their working life will be particularly affected.
This is the 4th time-bomb.
6 The age pension
6.1 Basic structure
The age pension is indisputably complicated, and a brief review may be helpful.
Detailed descriptions can be found at
https://www.humanservices.gov.au/individuals/services/centrelink/age-pension
https://www.dss.gov.au/seniors/benefits-payments/age-pension
https://www.dss.gov.au/benefits-payments/indexation-rates-july-2019
A somewhat simplified description is as follows:
The full pension for a member of a couple is lower than for a single person.
The full pension is reduced by the application of tests on assets and incomes – whichever test gives the greater reduction is the one that applies.
Assets reduce the age pension by $78 per annum per thousand dollars’ worth of assets (often expressed as $3 per fortnight per $1,000) above a threshold.
Despite frequent claims to the contrary, including on the Human Services website quoted above, the retiree’s home is assessed by the asset test.
The assessment is achieved by applying an asset test threshold which is lower for homeowners than for renters (currently by $210,500 for singles), but the effect is exactly the same as using the renter threshold and treating the home as a non-financial asset worth $210,500 – indexed to CPI.
Regardless of how the process is defined mathematically, claiming that the home is not assessed is simply false.
Income reduces the age pension by 50 cents per dollar of income earned above a threshold, except that
- The first $7,800 per annum of employment income is not counted
- Income from financial assets (bank accounts, shares, superannuation accounts etc) is deemed to be 1%, for asset value below a threshold, and 3% above that; then the deemed income is used in the income test.
The full age pension, for singles or members of a couple, is usually indexed to MTAWE as discussed previously. Every other relevant figure (the income test deeming threshold, the asset test threshold, the assumed value of the home – or, equivalently, the homeowner’s asset threshold) is indexed to CPI.
Apart from the home, the most significant asset which pensioners own is likely to be their financial assets, so a convenient way to describe the age pension graphically is to plot the value of the pension against the value of financial assets – as shown in Fig 4 for a single renter and for a homeowner, with no significant assets or income other than the financial assets.

Additional non-financial assets would shift the asset-test-controlled region further to the left. Additional income lowers the income-test-controlled part of the curve. For example, in Fig 5, each person is assumed to earn $20,000 per year.
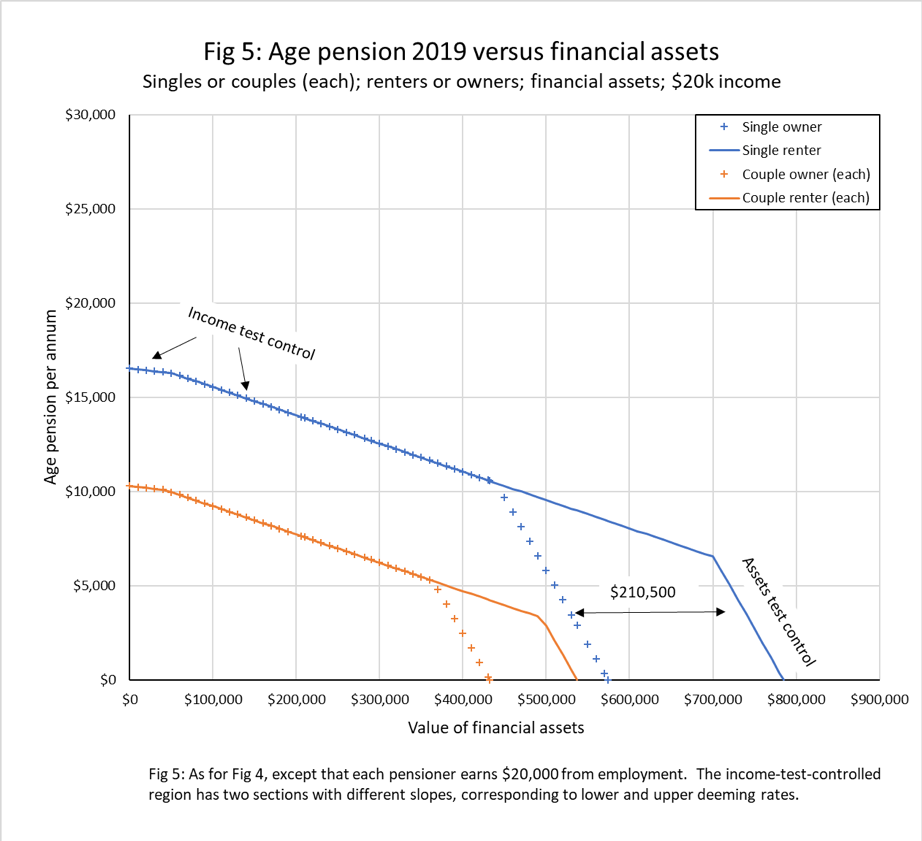
Graphs such as Fig 4 allow visualisation of the complex behaviour of the age pension, which can otherwise be very confusing. For example, a quick glance at Fig 4 shows that for the case considered, owning a home will reduce the age pension by nearly $20,000 per year for a single age pensioner with around $600,000 worth of financial assets but the effect is far less with $400,000 worth of assets.
The curves also show the steep asset-test-controlled region, where the age pension decreases at a rate of 7.8% ($78 per annum per $1,000 of assets), which tends to overwhelm the increase in actual earnings from the assets. Although it is a major problem in itself it will not be discussed in detail here, in the interest of brevity.
6.2 The age pension time bombs
Figs 4 and 5 give snapshots at a particular point in time. To examine the behaviour of the age pension over extended periods, however, it is best to relate asset values and income to the average wage.
This is done in Fig 6 which shows the projected curves over the next 4 decades for a single renter, with no other assets, and in Fig 7 for a member of a homeowner couple. Note that each curve is calculated using the projected average wage for that year.
Except for part of the full age pension area of the curves, where they all overlap because the age pension is indexed to wages growth, the curves show a steady trend towards lower age pension for a given financial asset base.
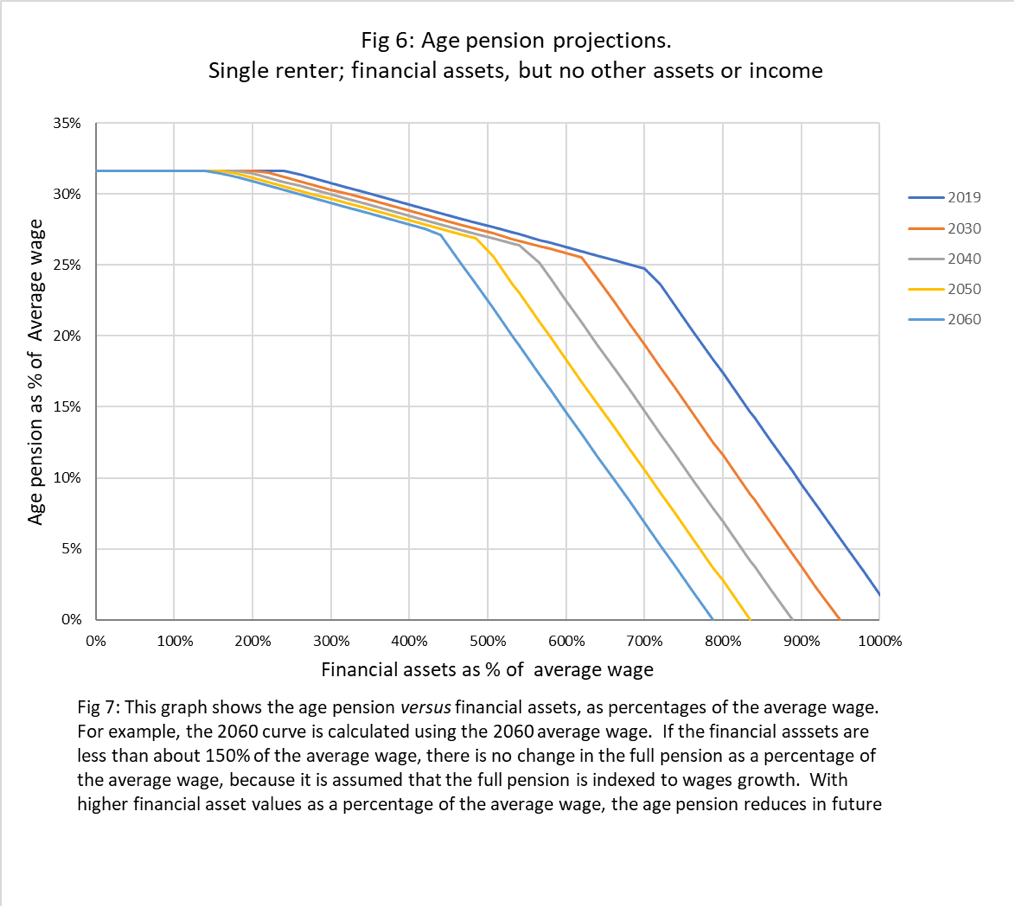
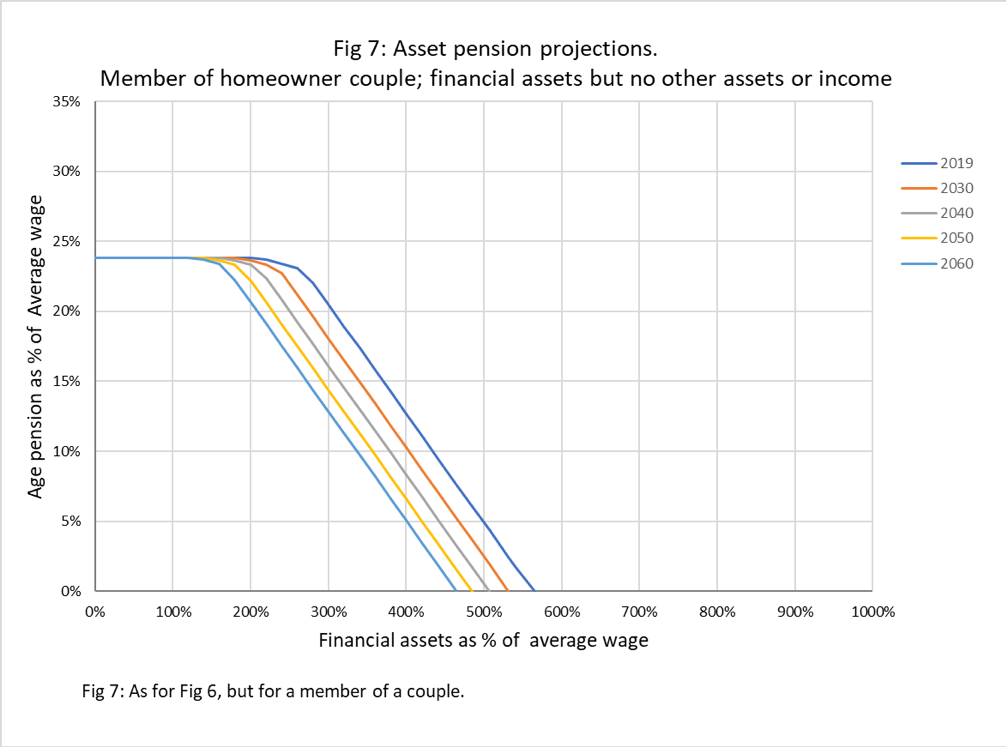
Because only the full pension is indexed to wages growth and other parameters are indexed to CPI, it is mathematically inevitable that the structure of the system will automatically change slowly over time. Relative to living standards, as indicated by the average wage:
- Part age pensions will become harder to get, as the upper asset threshold shrinks.
- Part age pensions for a given value of financial assets will reduce.
These are the 5th and 6th time-bombs.
What we are seeing here is universal: if different components of the system are indexed in different ways, the structure of the system will automatically change over time – even if the age pension is radically restructured.
6.3 A case study: effects of indexation on the individual retiree.
It is obvious in Figs 6 and 7 that someone beginning retirement in future years will receive less age pension for a given value of assets, when both are expressed relative to the average wage. i.e. to community living standards.
Fig 7 shows how the 5th and 6th time-bombs work for a specific case: a single homeowner who retires at age 67 with 8 times MTAWE ($614,000 in 2019) in an allocated pension account, from which only the age-based minimum is withdrawn, and who has no other income or assets.
Four cases are shown, for retirement in 2019, 2030, 2040 or 2050.
The allocated pension is assumed to be invested in a “balanced” fund returning 4.8% nominal, less 0.5% investment fees (these values are taken from the ASIC Money Smart superannuation calculator, neglecting the small administration fee).

Because it is assumed that the retiree in each case starts with 8 times MTAWE in the allocated pension account, both the account balance and the minimum withdrawal, as a percentage of MTAWE only depend on age. Thus, there is only one line for allocated pension income in Fig 8. It falls fairly steadily as capital is depleted in the account.
As the asset value falls, the retiree eventually becomes entitled to a part age pension. Starting in 2019, this retiree would begin getting a part age pension within a couple of years. The retiree starting in 2050 would have to wait a few years longer.
Thereafter, the later retiree always gets a lower age pension, relative to MTAWE. The full age pension – which each of these retirees approaches in their early 90s – is, however, constant as a percentage of MTAWE as already discussed.
The cause for the different treatment of full and part age pensioners is that the full pension is indexed to wages growth, while most of the factors controlling the part age pension are indexed to CPI. If Fig 8 is reworked for a different set of assumptions (for initial balance, investment returns and withdrawal rate), the detailed shapes of the curve will alter, but the general conclusions will be unaffected.
The obvious solution is to index all parameters to wages growth, and then all the curves for part age pensions in Fig 8 will be the same and the system will be stable over time.
As it stands, the part age pension is designed to slowly become harder to get, and less generous (for a given asset value relative to living standards) – another demonstration of the 5th and 6th time-bombs.
7 Conclusion
This paper, based on relatively straightforward spreadsheet modelling, has exposed a number of time-bombs in the structure of superannuation and age pension. These time-bombs are not particularly obvious, but they have the effect of surreptitiously increasing taxation, decreasing superannuation pensions and making the age pension harder to get and less generous. This will reduce the prosperity of retirees and hence of the country as a whole.
The time-bombs all have their origin in failing to index all parameters in the same way. The natural choice for an index is wages growth, because that is directly related to living standards, but if some other index is used it is still important that it be used consistently throughout the system to maintain stability.
Even if the superannuation and age pension schemes are radically altered, it remains important to index all relevant parameters in the same way. Otherwise these time-bombs will be inevitable.
8 Disarming the time-bombs
The Review of the Retirement Income System panel is scheduled to produce a consultation paper in November 2019.
The 6 time-bombs discussed in this paper merit consideration because they touch directly on so many of the issues flagged in the Terms of Reference: “adequate retirement incomes”, “appropriate incentives for self-provision”, “improve understanding”, “outcomes”, “the role of each pillar”, “distributional impact … over time” and, most importantly, “establish a fact base”.
Identification of these time bombs is a contribution to the establishment of a fact base on retirement incomes. Fortunately, the time bombs can be disarmed by regularising indexation throughout the superannuation and age pension systems.
30 October 2019
***********************************************************************
1 ping
[…] against a), c) and d). The age pension is more complex, especially in the long term (see https://saveoursuper.org.au/retiree-time-bombs/ ) but some cases are easy to […]