
by Jack Hammond and Terrence O’Brien
Progress, far from consisting in change, depends on retentiveness. ….. when experience is not retained, as among savages, infancy is perpetual. (Georges Santayana, The Life of Reason, Volume 1, 1905)
|
2 |
|
3 |
|
4 |
|
5 |
|
8 |
|
8 |
|
8 |
|
9 |
|
9 |
|
11 |
|
12 |
|
12 |
|
15 |
|
15 |
|
16 |
|
17 |
|
18 |
|
19 |
|
19 |
|
19 |
|
20 |
|
21 |
|
22 |
|
22 |
|
23 |
| Appendix A: Assumptions for Charts 1, 2, 4, 5 and 6 | 25 |
| About the authors | 27 |
1. Overview
Accumulating personal savings to a level sufficient to support a self-financed retirement takes a working lifetime. Regrettably, the Coalition government has given a sound policy framework just 10 years to deliver a result, before destroying it. In 2007 it enacted the well-researched Simplified Superannuation reforms to encourage workforce participation, build lifetime savings and improve retirement living standards, while reducing reliance on the Age Pension. Simplified Superannuation was built around two key ideas: softening the cut-off rate for the Age Pension assets test and delivering tax-free super drawdown for most over-60s.
With effect from 2017, the Coalition government has completely reversed policy direction on those two central ideas of the 2007 reforms. The 2015 and 2016 Budgets separately (and perhaps accidentally) created, from 2017 onwards, incentives for a retirement strategy of maximising income from accessing a substantial, continuing Age Pension, supplemented by moderate superannuation saving. In the example we use in this article to illustrate these incentives, for a couple with their own home, lifetime savings should logically be self-limited to about $400,000.
Oddly, the optimum use of the Age Pension suggested by the Coalition government’s incentives will tend to drive people towards accessing about 94% of the full Age Pension. This is signalled principally by ‘taxing’ superannuation income from savings between $400,000 and $800,000 at an effective marginal tax rate of over 150%. This results from doubling in January 2017 the reduction rate in the Age Pension assets test, back to its pre-2007 level. Over the asset range of $400,000 to $800,000, doubling lifetime savings leads to about $11,000 less overall income each year, due to the impact of the Age Pension assets test.
Only when superannuation savings rise to $1,050,000 is it possible to enjoy more income in retirement than from saving $400,000 and taking 94% of the full Age Pension. But the July 2017 superannuation changes make it much harder to ‘save across’ the savings trap between $400,000 and $1,050,000. From 1 July 2017, would-be self-funded retirees have been caught in a pincer movement between the Age Pension changes and the superannuation changes. Those already with super balances in the ‘savings trap’ between $400,000 and $1,050,000 are in effect encouraged to spend the excess (for example on holidays, a more valuable house, or renovations), at no cost to their annual income: the Age Pension will make up the shortfall in superannuation income.
Unlike for the 2007 system it replaced, there is no publicly available, official modelling of the 2017 superannuation and Age Pension changes with the sufficiently long, 40-year horizon necessary to clarify whether the new system improves retirement living standards and fiscal sustainability or (as we argue) will very likely worsen the.
Even without the necessary long-term modelling, it is clear that the rapid transition that was underway from reliance by most on a full Age Pension towards more Australians supplementing a diminishing part Age Pension with increasing superannuation savings will now be greatly slowed or halted.
Moreover, the Coalition government’s reversal of its own policies in just a decade (and without appropriately grandfathering the previous rules for those who had acted on them) has seriously damaged confidence in both superannuation as a repository for life savings, and in the Age Pension as the safety net for those less able to save. ((For an explanation of grandfathering, see our article in SuperGuide.) We argue that the incoherence and perverse incentives now at the heart of retirement income policy presage the need for further policy changes. Age Pension and superannuation policies are now Budget-to-Budget propositions.
Another consequence is that government ambitions to load new tasks on to superannuation incentives, such as creating deferred income products or assisting saving for a first home, are likely to fail. If citizens can’t trust the government to respect obligations to those who trusted their lifetime savings or retirement income to yesterday’s laws, why should they allocate additional savings for a decade or more hence on the basis of today’s laws? The 2016 election saw Labor, Liberals and the Greens in a chaotic, ill-specified competition to raise more tax from superannuation, with no modelling of the long-term effects. This does not augur well for future policy making in this most complex policy area, where mistakes have long-lasting consequences and savers’ confidence is easily destroyed and very difficult to rebuild.
When a future government is forced to correct the mistaken 2017 changes in retirement income policy, it will have to rebuild public confidence in rule-making for pensions and superannuation. It will have to offer a clear strategic vision for sustainable change and demonstrate the long-term consequences of proposed change for both better retirement outcomes, and more sustainable budget outcomes. This will require published, contestable long-term modelling. The government will have to consult meaningfully and assure savers and retirees that any future, significantly adverse changes that may be necessary will include appropriate grandfathering provisions. All these approaches have been used successfully in the past, but were abandoned for the changes taking effect in 2017.
2. The end of a decade
In just the decade since Simplified Superannuation was introduced in 2007, the reasons for the two key elements of its approach and the evidence behind the reforms seem to have been forgotten.
The core Simplified Superannuation ideas were introduced in a lengthy discussion paper with the 2006 Budget, and open to consultation for 4 months. Elements of the strategy took effect from July to September 2007. Revenue costs to the budget were shown for a 4-year horizon, and modelling published by Treasury both at the time and subsequently, showed how the measures would work over a projected 40-year horizon to achieve their intended effects. (The package is sometimes referred to in later documentation as the ‘Better Super Reforms’.)
Notwithstanding this careful research and development of Simplified Superannuation, its key ideas shaped Australians’ work, saving, and retirement decisions for just a decade before their reversal.
The two key ideas were reversed, not on the basis of new evidence or better analysis, but with a mere inversion of rhetoric. For savers under the Howard and Costello government, following legislated incentives to self-funded retirement was a necessary adaptation to an ageing population, weak labour force participation of older workers, rising incomes and rising expectations for retirement living standards. Now under Prime Minister Turnbull, Treasurer Morrison and Minister O’Dwyer, following those incentives has become “tax minimisation and estate planning”.
As we shall see, discretionary saving balances high enough to yield retirement income above the Age Pension are now discouraged for many under the current Coalition government by extremely complex policy changes that penalise those who were saving, or had retired, on the basis of the policy of the previous Coalition government.
3. Why is retirement income policy so contested?
Some regard today’s special tax treatment of super as an indefensible gift to the better off, and an unwarranted, arbitrary concession by government that could be reconfigured however the government’s appetite for revenue warrants. Superannuation emerged in the late 1800s without any specific or concessional tax treatment. Why can’t we return to that situation today? There are two major reasons:
- First, the creation of the Commonwealth Age Pension in 1908. The Age Pension is a fabulous product: the ultimate unfunded, defined benefit payment. From the view of the recipient, it provides a modest but totally secure retirement, with no risk to income from economic recession or interest rate falls, no inflation risk (because indexed), and no ‘longevity risk’ of outliving the retiree’s savings. Moreover, it enjoys a high and demographically enhanced degree of protection from political meddling almost as great as provided by the family home, and more protected than superannuation or negatively-geared investment property (to compare the Age Pension with just the three forms of saving least disadvantaged by income tax). The Age Pension’s actuarial value to a retired couple is estimated to be over $1 million. Its value is rising as life expectancy rises, and interest rates and equity returns remain low and particularly uncertain.
- Secondly, the Commonwealth’s income tax levied since 1915 is now imposed at high and progressive rates on nominal income, which discourages saving relative to spending, and most heavily discourages long-term saving. As the Henry review, Australia’s Future Tax System, noted:
The essential reason for exempting lifetime savings or taxing them at a lower rate is that income taxation creates a bias against savings. The income taxation of savings therefore discriminates against taxpayers who save. They pay a higher lifetime tax bill than people with similar earnings who choose to save less. As savings can be thought of as deferred consumption, the longer the person saves and reinvests, the greater the implicit tax on future consumption …. For a person who works today and saves, taxing savings also reduces the benefit from working. (p 12)
The taxation and regulation of superannuation have to be tailored to offset these two major disadvantages of the tax bias against saving and the provision of an excellent competitive product ‘for free’; otherwise, there would be no long-term, superannuation-based saving locked away for retirement.
For retirement income policy, the significance of the $1million-plus value of the Age Pension for a couple is impossible to overstate. If a modest retirement income worth $1 million or more and guaranteed for life is to be gifted to anyone who ‘passes’ an income or assets test which does not count the family home and makes reasonable allowance for other assets, then the incentive to save and take up the risks of self-financed retirement instead of the Age Pension is low. If self-financed retirement is to be viable, incentives have to be very carefully designed to avoid discouraging incremental saving, even as savings accumulate to high nominal amounts.
To labour an obvious point, only relatively rich people will be able to amass lifetime savings to better the Age Pension. This is the conundrum at the heart of the retirement income policy debate. Many on the political left consider the provision of super incentives to ‘millionaires’ to be unfair, even though the median value of a Sydney house is now more than $1 million, as is the value of the Age Pension for a couple. In contrast, many on the political right regard too-easy access to the Age Pension as destructive to saving, and understand that Age Pension rules and superannuation incentives cannot be effective if they discourage saving by the very group who may be able to save more than the value of the Age Pension over the course of their working lives.
The final practical complication in the debate over retirement income policy is that any adjustment of policy disadvantageous to existing retirees or those close to retirement has to deal with the uniquely long-lived nature of lifetime savings commitments and the 30 or 40 year horizons necessary for individuals to lay the foundation for self-funded retirement, as discussed in the outline by Save Our Super of principles for grandfathering in the May edition of SuperGuide.
4. What was Simplified Superannuation designed to do?
The need for retirement income reforms was identified in the first and second Intergenerational Reports of 2002 and 2007. The Charter of Budget Honesty Act 1998, which Treasurer Costello introduced, requires Intergenerational Reports to be produced every 5 years. They are to assess the long-term sustainability of current Commonwealth government policies and how changes to Australia’s population size and age profile may impact on economic growth, workforce and public finances over the next 40 years. The forty-year outlook is a useful horizon. It is a long enough timeframe to tease out the effects of relatively predictable, slow demographic change, but not so long as to over-extend relatively unreliable economic forecasts. (The increased uncertainty of economic projections over such a long horizon can be moderated by sensitivity testing of alternative scenarios.)
The inaugural 2002 Intergenerational Report flagged worrisome trends in both Age Pension costs and the costs of the Commonwealth’s old superannuation schemes, which although already closed to new entrants, had accrued large unfunded employer liabilities.
A central challenge for financing retirement income policy is increasing life expectancy. In Australia, as in many of the advanced economies, …. life expectancy has been increasing by 2.5 years per decade, three months per year, six hours per day.
If these gains are projected, as has been done internationally for the Human Mortality Database, a Western European or American child born in 2007 and 10 years old today, has a 50% chance of still being alive around 2110, at an age of 103. Australian life expectancy projections are probably similar. Past projections of growth in life expectancy have all been exceeded by experience. Prior to the 1970s, the primary driver of Australian improvement was rising life expectancy at birth, which increased the number of people who reached retirement age. But since the 1970s, there has been marked growth in life expectancy at 65, increasing the average time spent in retirement by more than 6 years for women and nearly 7 years for men. Since 2012, more Australians die each year aged 100 or more than aged 1 or less.
Faced with this ageing demographic, Treasurer Costello wanted to lift potential retirement livings standards while reducing the heavy reliance on the Age Pension. The objectives of changing pension arrangements and reducing taxation on savings for retirement were to….sweep away the current tax complexities faced by retirees; improve retirement incomes; give greater flexibility over how superannuation savings can be drawn down; and improve incentives to work and save.
The Howard/Costello government understood the need to move early but gently, so that changes did not disadvantage present retirees, but gave younger generations the time and opportunity to build the retirement living standards that they preferred and for which they were prepared to work and save.
The first key idea of the 2007 reforms was to reduce the disincentives to higher saving that locked many retirees into the Age Pension. The main disincentive was the high cut-off rate of the Age Pension for those whose assets disqualified them from a full pension:The assets test is very punitive as retirees must achieve a return of at least 7.8 per cent on their additional savings to overcome the effect of a reduction in their pensionamount. This high withdrawal rate creates a disincentive to save or build retirementsavings. (p 37) …It is proposed that the pension assets test taper rate be halved from 20 September 2007 so that recipients only lose $1.50 per fortnight (rather than $3) for every $1,000 of assets above the relevant threshold. This would mean that retirees would need to achieve a return of 3.9 per cent on their additional assets before they are better off in net income terms — that is, after taking account of the withdrawal of the Age Pension. (p 37) …The reduction in the assets test taper rate would increase incentives for workforceparticipation and saving especially for those people nearing retirement who will stilldepend on the Age Pension to fund part of their retirement. (p 38)
The second key idea was to clear away the thicket of complex tax treatments that had built up on the retirement phase of superannuation, and concentrate tax on the contribution and accumulation phase for all but the recipients of pensions from schemes that had not been funded through the accumulation phase by employer contributions:Superannuation benefits tax is by far the most complicated and is the tax that individuals must confront when entering or contemplating retirement. At present, it is difficult for anyone to understand how their superannuation benefits will be taxed.A lump sum may include up to eight different parts taxed in seven different ways. (p 2) …. Under the proposed plan, from 1 July 2007:
- Superannuation benefits paid from a taxed fund either as a lump sum or as an
income stream such as a pension, would be tax free for people aged 60 and over.– Benefits paid from an untaxed scheme (mainly affecting public servants) would still be taxed, although at a lower rate than they are now for people aged 60 and over. (p 3) One measure of the degree of simplification achieved by Simplified Superannuation in 2007 is that its measures:cut the number of pages of superannuation law in the income tax assessment Acts by over a third.
The interaction of these two ideas was a slow phasing out of access to the part Age Pension as savers’ means-testable, non-housing assets (especially superannuation balances) grew. Charts 1 and 2 are drawn from a model of the Age Pension’s income and assets test interactions with superannuation savings which is described in Appendix A. The model teases out the impact on combined Age Pension and superannuation income of a range of possible superannuation savings levels attained at retirement, between age 65 and 74. For compressed exposition, our charts show just the case of a couple who are home owners. The underlying model and its data, which is archived and available on request from the authors, also generates results for single retiree home owners, and for singles and couples who are not home owners.
As shown in Chart 2 illustrating Age Pension eligibility under Simplified Superannuation but with September 2016 pension values, a couple’s full aged pension of $34,477 is received up to super savings of $250,000 (case 3). Then the income deemed from superannuation savings triggers the income test to reduce the part pension (case 4). For superannuation savings of $350,000 upwards, the assets test becomes binding to continue gradually reducing the part Age Pension (case 5) until it is completely withdrawn by super savings of $1,200,000 (case 22).
The key point to note is that for every $50,000 step up in super savings, the withdrawal rate of the part pension was deliberately calibrated to ensure the saver received some increase in combined income from super savings and the remaining part pension.
There was no disincentive to save more, nor any incentive to dissipate existing savings in order to draw a larger Age Pension. The effective marginal tax rate on the income from additional superannuation saving between $400,000 and $1,150,000 was almost 80% — obviously very high, but an inevitable compromise in moving from full to no Age Pension without continuing, fiscally costly access to the part Age Pension at excessively high income levels.
Chart 1: Twenty-five illustrative super balances on retirement at 65 (couple, homeowners)
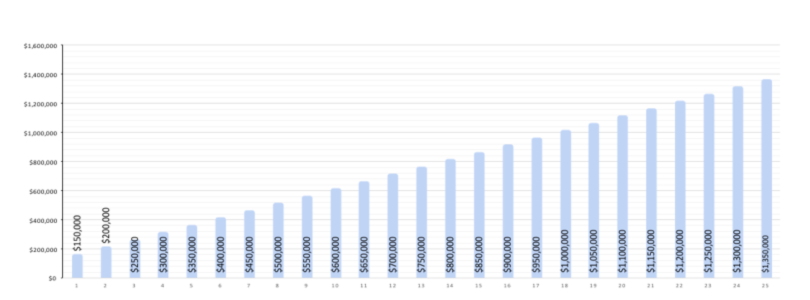
Chart 2: Corresponding annual retirement incomes, with legislated minimum super drawdown (5% per annum)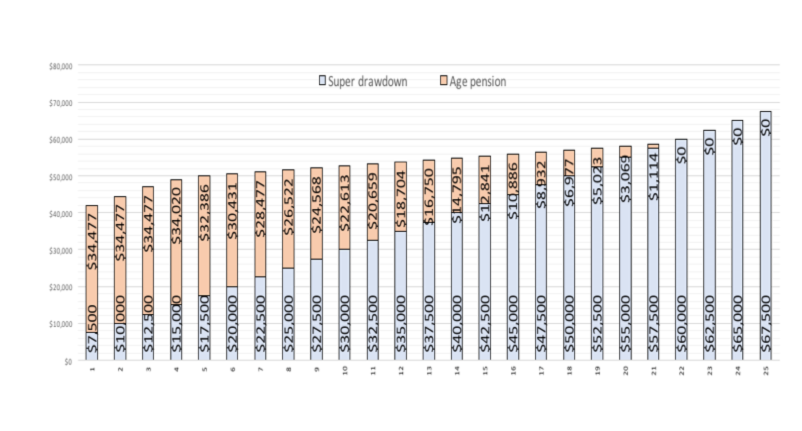
Note: see Appendix A for assumptions and source.
5. How was Simplified Superannuation working?
Some recent commentary suggests that Australia’s pre-2017 Age Pension and superannuation policies, however simple and attractive, were a policy luxury for a fiscally lucky Howard/Costello government, when budgets were somehow in surpluses approaching 2% of GDP. But the generosity of the earlier Coalition government is now said to be unaffordable after 10 years of budget deficits, and with deficits stretching ahead for at least several years more.
More specifically, Simplified Superannuation is claimed by its critics to have left the overall structure of superannuation tax treatment excessively costly to revenue (measured by one version of Treasury’s Tax Expenditure Statement), excessively favourable to the rich, and to be ‘fiscally unsustainable’ over time.
Those three criticisms are each heavily contested. Full discussion of the debate is beyond the space available in this article, but we point interested readers towards thoughtful analysis by tax and superannuation authorities such as Ken Henry, Robert Carling and Jeremy Cooper. Save Our Super has itself summarised many of these arguments in a submission on the 2017 superannuation changes.
Theory aside, the main reason for the 2017 changes in retirement income policy seems to have been a hunger for government revenue within the four year forward estimates horizon of the budget papers. We note in passing that the budget has not been pushed into deficit by retirement income policy that was set a decade ago, was shown to be sustainable, and has been largely stable since. Rather, budget deficits arose from discretionary expenditure growth in the global financial crisis that is not yet reversed, and weak revenue growth. Simon Cowan and Michael Potter have shown that Australian fiscal deficits and debt are driven from ratcheting up public expenditure, with tax increases following to partly finance higher spending levels.
Short and long run costs and benefits
After revision of the Simplified Superannuation measures following consultation, Treasury estimated the measures would cost $7.2 billion in 2006 dollars over the years 2006-07 to 2009-2010. It is clear from the publications cited below that these cost estimates were well-vetted and modelled within Treasury, well-documented and publicly contestable. We have no reason to believe the initial costs of the reforms were significantly different from the amounts documented (and budgeted for) at implementation.
But the important issue for changes in retirement income policy is not the costs of such changes over 4 years, but rather their impact over 40 or more years. It is the long-term effects of the changed incentives on savings and work over a 40 or more year career, and on Age Pension dependence over a 30 or more year retirement, that allow judgement of whether the measures will have their intended effects on increasing workforce participation of older workers, increasing retirement living standards and improving fiscal sustainability by reducing demands on the Age Pension compared to what it would otherwise have been.
Modelling the longer run impacts
Fortunately, the evolution of the retirement income system up to the 2017 changes has been extensively modelled. Since the mid 1990s, Treasury maintained a specialist retirement and income modelling unit to analyse tax, pension and super policy changes, and to assist distributional analysis and intergenerational modelling over the necessary lengthy time frames. That work used a model known as RIMGROUP.RIMGROUP is a comprehensive cohort projection model of the Australian population which starts with population and labour force models, tracks the accumulation of superannuation in a specified set of account types, estimates non-superannuation savings, and calculates tax liabilities, social security payments including pensions and the generation of other retirement incomes.
The model can be run for very long projection horizons. By 2007, RIMGROUP was already being used to report effects from Simplified Superannuation on income adequacy in retirement. In a 2008 publication, the projection horizon was then said to be potentially out to 2060, if required and appropriate (see Attachment A to that publication). According to a 2009 conference paper from Treasury staff,Aggregate modelling based on RIMGROUP has been of considerable policy significance. It has been used in preparing all Intergenerational reports and in the analysis of implications of the 2009 Budget changes to age and service pensions. (p 2)
In 2011, a Treasury conference paper using RIMGROUP examined projections of the long-term adequacy of Australian retirement Incomes, and noted:government policies over recent years such as the co-contribution, the Better Super reforms [otherwise cited in this paper by its 2006-07 title of Simplified Superannuation] and the foreshadowed Age Pension age increases provide strong incentives to save more and to participate in the workforce for longer. (p 22 )
In 2012, Treasury updated RIMGROUP modelling based on the 2007 Simplified Superannuation Age Pension and superannuation changes and incorporating other significant retirement policy changes up to 2012. They also factored in the future increases in the Superannuation Guarantee rate scheduled out to 2025.
The key projected trends are shown in Chart 3.
One element of Chart 3 has been widely mentioned, including by Jeremy Cooper and the Shepherd Review’s Statement of National Challenges: the very small projected rise over 42 years in the proportion of those who, while eligible by age for the pension, instead wholly self-finance their retirement. Interpolating approximate numbers from Chart 3, it appears the rise is from about 18% to 21%. On the face of it, that is disappointing. Some who have commented on Chart 3 have used it to argue that Australia’s retirement income system, as revised by Simplified Superannuation, was underperforming relative to the costs of the Age Pension and the superannuation tax concessions.
But the second major trend in Chart 3, little remarked upon, is that the proportion receiving the full Age Pension was projected on the foundation of Simplified Superannuation to halve to about 30% of the retired population by the late 2040s, and the proportion receiving only a part Age Pension would double to almost 50%. To underscore the point: overall reliance on some Age Pension declines only slightly, but reliance on the full Age Pension declines massively. This is surely a notable policy success attributable largely to the incentives of Simplified Superannuation, both in terms of limiting the growing fiscal cost of the Age Pension and increasing personal choice, accountability and reward for those who choose, and are able, to save more to support their own preferred retirement living standards.
Chart 3: Treasury projected changes in Age Pension-assisted and self-financed retirement, 2007-2049
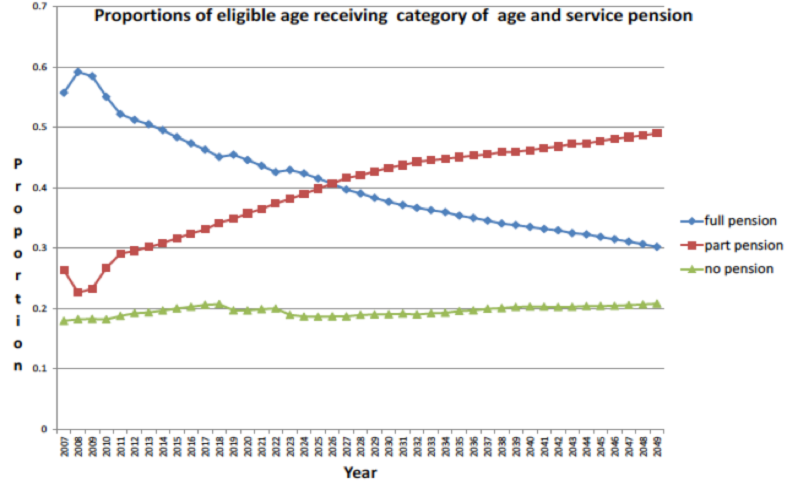 Source: Rothman. G. P., Modelling the Sustainability of Australia’s Retirement Income System, July 2012.
It is instructive to examine why the decline in reliance on at least some Age Pension is so slow.
- If a retired couple who might, before Simplified Superannuation, have received a full Age Pension were to forgo the Age Pension and instead wholly self-finance their retirement, what would that require?
- They would have to save to build lifetime savings in superannuation of over $1 million (on top of other assets such as their residence, car etc). Realistically, such saving takes decades, if not a full working career.
- If the retired couple save strongly in superannuation but fall appreciably short of the $1 million target over their remaining working years, what would happen?
- They would receive some part Age Pension, instead of the full pension.
- What would happen if, having retired without need for an Age Pension, the couple’s growing life expectancy, or a downturn on their superannuation fund earnings, led over time to the depletion or exhaustion of their superannuation savings?
- They would quite properly revert in advanced age to reliance on a part or ultimately a full Age Pension, helping to limit overall growth of totally self-funded retirement.
As the Treasury modelling paper explained,… while the proportion of eligible age not receiving an Age Pension remains around 20 per cent, many do not get an Age Pension for the whole of their retirement. Between Age Pension age and 70, the proportion without a pension will typically exceed 40% but with drawdown in retirement and successive cohorts living longer, the average over all ages is sticky at around 20 per cent. (p 7)
The Simplified Superannuation changes of 2007 obviously affected all ages, between early-career workers with 40 or more years of saving to reach retirement, through those too close to retirement to much increase their lifetime savings, to those already retired. The biggest impact on lifetime saving obviously occurs with those furthest from retirement. So the policy effects of Simplified Superannuation (and of the Superannuation Guarantee increases) take decades to build up as the system matures. People can’t jump instantly from full Age Pension to full self-financing no matter what the incentives, but need to build up lifetime savings to a high level to achieve self-financing. During the transition period, the most one can expect is to see the proportion receiving a full Age Pension falling and the proportion receiving a part Age Pension rising, exactly as projected in Chart 3.
In summary, it takes a lifetime to build life savings. The 40-odd year horizon shown in Chart 3 is pretty much the minimum horizon necessary to evaluate the effects of retirement policy change, and the picture it shows is just what any realistic observer would expect. It is a picture of gradual and growing retirement income policy success, not of failure. As for the long-term sustainability of the Simplified Superannuation system created in 2007, the modelling paper concluded in 2012:The paper finds that Australia is in a very strong position in relation to the sustainability of its retirement income arrangements compared with almost any other country in the world. (p 2) However given the significant part of the government’s budget involved, the increasing costs as the population ages and the many factors influencing sustainability, this relative strength should not lead to complacency. (p 3)….. Notwithstanding the risks identified above, this paper agrees with the broader Mercer finding that Australia sits comfortably in the best group of international retirement income systems. In Australia, the superannuation and retirement income arrangements add strongly to funds available for investment, add to national saving, and the means tested age and service pension arrangements appear sustainable. (p 18)
6. How will the 2017 Age Pension and superannuation changes work?
Tougher Age Pension assets test from 1 January 2017
The 2017 assets test reverts from the Costello Simplified Superannuation reform that applied from 20 September 2007 to the earlier, steeper taper that applied before 2007. (See Charts 4 and 5 below; Chart 4, showing illustrative superannuation balances on retirement, is like Chart 1 but has five fewer cases of high superannuation saving balances, because the harsher taper on the assets test phases out the part Age Pension at lower levels.) The measure was introduced in the 2015 Budget by Joe Hockey, but Scott Morrison was the Social Services Minster at that time, and had a key role in explaining the changes. According to one newspaper report: Mr Morrison said the changes to achieve a “more sustainable pension” restores the $3 taper rates changed by the Howard government in 2007 when the budget was in surplus. “Those levels of taper rate changes from 2007 when it was reduced from $3 to $1.50 are no longer affordable,” he said. … “Welfare is for need. Superannuation requires incentive,” Mr Morrison said…. Single people who lose their pensions will need to draw down about 1.8 per cent on their additional assets to maintain their current income level. Couples will need to draw down 1.76 per cent.
Nowhere in the Minister’s or the Social Services Department’s explanation of the measure was there any attempt to address Simplified Superannuation’s strategic reasoning and its evidence as to why the disincentives of a high taper rate on the Age Pension had been removed, to the benefit of both future retirement income and future fiscal policy outcomes. It was as if Simplified Superannuation had been airbrushed from history, and its arguments, evidence, long-term modelling and research could be simply contradicted by asserting the need for a ‘rebalancing’ or a ‘reset’, to ‘clean up the superannuation mess’: It is important that those people who are able to support themselves do so, and we are changing the social security system to encourage this. … The Assets Test will be rebalanced to provide additional assistance to non-homeowners and people with moderate assets, and will provide less support to those who are better off. More than 4 per cent, or 170,000, of pensioners with modest assets will have their part rate pensions increased by an average of more than $30 per fortnight due to the higher assets test free areas. …. Around 8 per cent of pensioners, those who have substantial assets (excluding the family home), will have their pension entitlements reduced or cancelled. Those people who lose their pension will automatically be issued with a Commonwealth Seniors Health Card, or a Health Care Card for those under pension age. The taper rate which is the rate at which the pension reduces for savings and assets over a certain threshold is being reset from $1.50 to $3. This means the pension will reduce by $3 a fortnight for every $1000 of assessable assets over the threshold. [emphasis added]
As shown in Chart 5, the 2017 Age Pension income test works to trim access to the full Age Pension from case 4, corresponding to a super balance of $300,000. Combined income from a part Age Pension plus superannuation nevertheless continues to rise to a local maximum of $52,395 per annum for a super balance of $400,000 (case 6). Beyond case 6, the 2017 assets test becomes binding (case 7) and continues to withdraw the part aged pension much more steeply than before — so steeply, in fact, that total pension and superannuation income now commences falling, even as the illustrative superannuation balances rise in $50,000 increments to $800,000 (case 14). To double superannuation savings from $400,000 to $800,000 attracts an effective marginal tax rate on income from that saving of over 150%.
The part Age Pension is completely removed at a superannuation balance of $850,000 in case 15, and total income, now exclusively from superannuation, begins to rise again. But it does not exceed the earlier local maximum income of $52,395 until an illustrative superannuation balance of $1,050,000 (case 19) and an income of $52,500. Note how close this superannuation balance is to the estimated actuarial value of the Age Pension to a married couple.
A similar conclusion has been reached by Tony Negline, in Saving or slaving: find the sweet spot for super, The Australian, 4 October 2016, and Save more, get less: how the new super system discriminates, The Australian, 26 November 2016. Negline’s estimated ‘sweet spot’ for the optimum strategy of maximising access to a part Age Pension blended with superannuation income is about $340,000, compared to the $400,000 shown in our tables. (This difference is unimportant for overall analysis of the issue, and appears to reflect different assumptions including about the mix of wealth between superannuation and other savings caught within the income and assets tests.)
Between superannuation balances of $400,000 and $800,000, an effective marginal tax rate on income from extra savings of over 150% means that if someone has committed $20 extra to superannuation when working, and on retirement draws $1 of income from that saving, their combined Age Pension plus superannuation income falls by almost $0.60, compared to if they had simply spent the $20 when they earnt it and drawn a larger Age Pension in retirement. Those incentives can’t be sustainable.
The extremely high effective marginal tax rates pictured in Chart 5 might not matter much in practice if they only occurred over a small range in which there weren’t many savers. But in reality, they matter a lot: Chart 5 shows a very wide savings trap of $650,000. The bottom of the trap is close to where the balances of many male super savers are now finishing up in their peak saving years (Table 1 below shows the projection for the fifth decile), and the top of the trap is close to the actuarial value of over $1 million of the full Age Pension for a married couple.
The government has created, presumably accidentally, a wide savings trap precisely where all the ‘retirement income savings action’ has to be, if people are to save more to reduce reliance on the Age Pension and to increase their retirement living standards.
Chart 4: Twenty illustrative super balances on retirement at 65 (couple, homeowners)
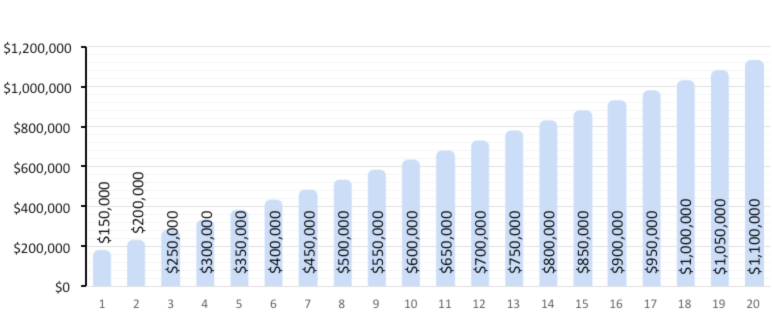
Chart 5: Corresponding annual retirement incomes, with legislated minimum super drawdown (5% per annum)
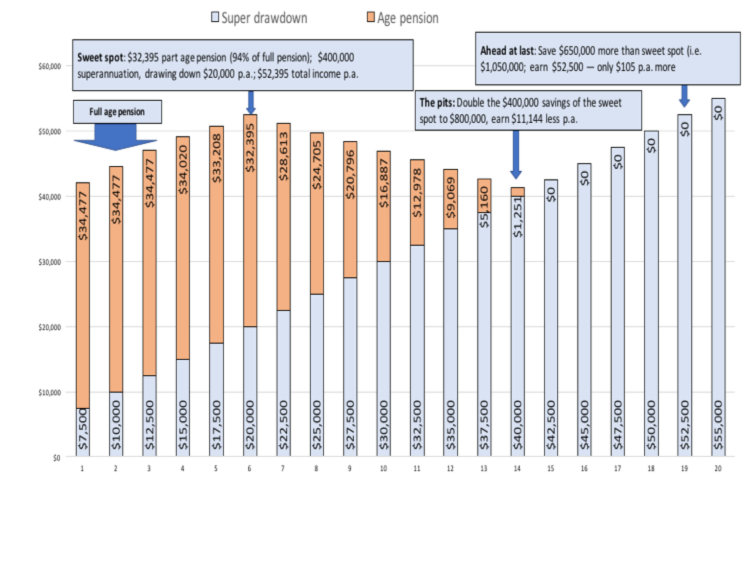
Note: see Appendix A for assumptions and source.
Table 1: Projections in 2008 of average superannuation assets for 5th decile by age group and gender, constant 2007-08 dollars
| 2010-11 | 2020-21 | 2030-31 | 2040-41 | |||||
| Age | Women | Men | Women | Men | Women | Men | Women | Men |
| 20‑24 | $6,000 | $8,000 | $7,000 | $9,500 | $8,500 | $11,000 | $10,000 | $13,500 |
| 25‑29 | $24,000 | $27,500 | $21,500 | $26,000 | $25,500 | $30,500 | $30,500 | $37,000 |
| 30‑34 | $48,000 | $53,500 | $42,000 | $51,000 | $50,000 | $60,500 | $60,000 | $72,500 |
| 35‑39 | $54,500 | $80,500 | $65,500 | $87,000 | $67,500 | $96,000 | $80,500 | $114,500 |
| 40‑44 | $62,500 | $104,500 | $90,000 | $130,500 | $89,500 | $140,500 | $106,500 | $167,500 |
| 45‑49 | $76,000 | $129,000 | $106,500 | $179,000 | $127,000 | $203,500 | $139,500 | $233,500 |
| 50‑54 | $99,000 | $168,500 | $138,500 | $239,000 | $184,000 | $294,000 | $197,500 | $331,500 |
| 55‑59 | $135,500 | $198,500 | $183,500 | $286,500 | $245,000 | $375,000 | $299,000 | $439,000 |
| 60‑64 | $200,500 | $273,500 | $266,000 | $353,500 | $384,000 | $479,500 | $530,000 | $606,500 |
Source: Rothman, G. and Tellis, D. Projecting the distributions of superannuation flows and assets, The Treasury, 4 July 2008
Note: Deciles are constructed by ranking individuals from poorest to richest, and dividing into 10 equal groups, each with 10% of the population. The first decile contains the poorest 10%, the second decile the second poorest 10%, and so on until the tenth decile, containing the richest 10%. So superannuation savers in the fifth decile shown above are richer than the poorest 40% of the population, but poorer than the richest 50% of the population.
Supporters of the sharper 2017 taper in the Age Pension assets test suggest that the 2007 assets test was unfair: they argue no one who owns a home and has a $1 million in superannuation or other assessable assets should be receiving a part Age Pension.
But to argue in this way is both unrealistic, and manifests a one-dimensional conception of fairness, which is viewed exclusively as taking from the richer to give to the poorer. It is unrealistic because its consequence — high withdrawal rates of the Age Pension — is perverse incentives. While fairness is of course subjective, most would agree that is not fair that people who forgo consumption and save more to increase their living standards in retirement and reduce their reliance on an Age Pension should instead get less retirement income. This is the perverse outcome for a large range of savings under the 2017 assets test. Balancing those two ideas of fairness — redistribution form rich to poor and recognising that extra saving will only occur if it gains some reward, rather than punishment — takes thought, close research and long-term modelling, to devise a workable system which lessens reliance on the Age Pension over time and does not discourage higher savings.
Superannuation changes from 1 July 2017
Of the 15 superannuation changes announced in the 2016 Budget, this paper considers only three of the biggest changes:
- the reduction by 44% in non-concessional contribution limits to $100,000;
- the reduction by 17% in concessional contribution limits to $25,000 per annum (or by 29% for those over age 50, who previously enjoyed a higher limit); and
- the unprecedented $1.6m transfer balance cap.
These measures from the 2016 Budget interact (whether intentionally or otherwise) with the Age Pension assets test restriction in the 2015 Budget. The 2015 Budget created the savings trap pictured in Chart 5. The 2016 Budget created restrictions that hinder superannuation savers from overcoming the savings trap, and that increase the probability that they will never escape from the trap.
The width of the savings trap is $650,000, the difference between case 6 and case 19 in charts 4 and 5.
To traverse the savings trap by non-concessional contributions under the old limit of $180,000 per annum would have taken 3.6 years — a very high rate of saving that very few could sustain. Under the new $100,000 limit taking effect on 1 July 2017, it would take 80% longer, or 6.5 years.
To traverse the savings trap by concessional contributions under the old limit of $30,000 per annum would have taken 21.7 years — a high rate of saving that very few could sustain. Under the new limit of $25,000 taking effect on 1 July 2017, it would take 20% longer, or 26 years. The abolition of the previous higher $35,000 cap for those over 50 is another subtle message to all superannuation savers: the current Coalition government is not bound by previous notions of grandfathering adverse change for those too close to retirement to be able to change their saving plans.
The obstruction to super saving imposed by the complex transfer balance cap is more opaque, but possibly more threatening over time. As Trish Power from SuperGuide has documented, the operation of the transfer balance is ridiculously complicated, with its supporting paraphernalia of Personal Transfer Balance Caps, Transfer Balance Accounts, Total Superannuation Balance Rules, First Year Cap Spaces, Crystallised Reduction Amounts, Excess Transfer Balance Earnings and Excess Transfer Balance Taxes.Moving beyond July 2017, most retirees will now need to monitor two lifetime superannuation amounts – their transfer balance cap, and their transfer balance account. The new policy applies to both existing and new super pension accounts from 1 July 2017, which effectively means the policy will apply retrospectively. Again quoting Trish Power from this same SuperGuide article:The fact that the Coalition doesn’t state the numbers of Australians immediately affected by this policy, and doesn’t state the hundreds of thousands of Australians who will be affected by this cap over the next 25 to 30 years is misleading. Add the millions of Australian retirees who will now need to monitor their transfer balance cap (for periodic indexed increases of the cap), and the same millions who will also need to monitor their transfer balance account for new money going into retirement phase, or existing money being removed from retirement phase (commuting pensions into lump sums), and the claim of less than 1% of fund members being affected is text-book propaganda. The government has just made retirement a lot more complicated for all Australians, including those Australians with nowhere near $1.6 million in super.As super balances increase, and the cost of a reasonable lifestyle in retirement increases, the $1.6 million cap (indexed for inflation in $100,000 increments), will be potentially within the reach of a hefty percentage of middle-aged and younger Australians currently in the workforce. Not only will millions of retirees have two life-time amounts that they may need to be mindful of, but an increasing number of older Australians will have to monitor these figures for the rest of their lives.
As Save Our Super has argued in a submission to the Senate Committee examining the superannuation legislation, there can be no doubt the 2016 superannuation re-complication has more than undone the simplification benefits of the 2006 proposals in Simplified Superannuation. The net effect of the transfer balance cap paraphernalia is again a clear message to superannuation savers: a well-researched, carefully thought-through set of transparent and well-costed and modelled reforms to influence savings for a lifetime has been reversed in just ten years. In superannuation, good policy can be driven out by bad policy, through the heat of a feverish election campaign, with poorly specified tax grabs on savers from three major parties competing to bamboozle electors, or perhaps just to assure them that spending bribes will be paid for, if at all, by someone else. Looking at the 2015 and 2016 measures from the perspective of their joint application in 2017, the policies look like a perfectly malevolent scheme to lock savers into the ‘sweet spot’ of permanent dependence on a part Age Pension only 6% below the full Age Pension, superannuation savings self-limited to $400,000, and any other saved funds placed either in assets that are outside the Age Pension assets test (for example, a more valuable residence, kitchen and bathroom renovations) or consumed.
Running down superannuation account balances
It may be objected to the analysis behind Charts 2 and 5 that it is unfair to the case for saving beyond $400,000 in superannuation, because someone who retires with a large superannuation balance doesn’t have to live only on the income from superannuation savings. They could also, as they age, gradually draw down the principal too, by reducing their account balances.
In reality, Charts 2 and 5 are already set in a legislative environment of increasing drawdown of superannuation capital, as the legislated minimum drawdown rate escalates with age from 4% (age 55 to 64) to 14% (95 or older) which is designed to limit use of allocated pensions for estate planning. The 5% drawdown rate at age 65 to 74 illustrated in Chart 5 would already involve some drawdown of capital in current market conditions, if we consider an assumed 2% real return over the recent rates of inflation of 1.0% – 2.0%.
We can also examine the consequences of a faster than legislated drawdown of superannuation principal in the context of the steeper Age Pension assets test taper on assumptions detailed in Appendix A. If superannuation drawdown occurs at the rate necessary to support the same total income (superannuation plus any part or full Age Pension) as the maximum total income enjoyed by anyone with a lower or the same superannuation balance, those savers in the ‘savings trap’ illustrated in Chart 5 have to deplete their savings earlier.
The biggest reduction in superannuation duration is at case 14, where making good from accelerated superannuation drawdown the biggest shortfall in income relative to case 6 causes their superannuation balance to be exhausted almost 7 years earlier. (At this point, case 14 presumably draws a full Age Pension.)
Chart 6: Reduced duration of superannuation savings if drawn down to match maximum income from any identical or lower superannuation balance (assuming 2% real return)
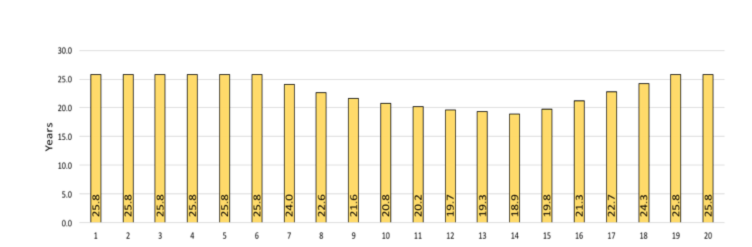
Note: see Appendix A for assumptions.
So from a retirement policy perspective, proposing that savers with superannuation balances already in the ‘savings trap’ draw down their superannuation principal to match the ‘sweet spot’ income is not a ‘free lunch’. It merely ensures the perverse incentives of the 2017 assets test lead to such savers returning up to 7 years sooner to draw a larger (or ultimately a full) Age Pension. Any short-term apparent gains to the budget are followed by long-term costs.
Of course, drawing down superannuation at an accelerated annual rate for as long as possible is only one way to maintain the income of the ‘sweet spot’ of case 6. Perhaps more likely is that the superannuation would not be spent annually to maintain income for as long as possible, but instead withdrawn in a lump sum to finance ‘bucket list’ travel, home renovations, or a more valuable principal residence. With wealth moved out of superannuation saving in this way, annual income would be topped up to the case 6 level by increased access to a fuller Age Pension.
7. Impact of the 2017 changes on behaviour
Aged pension assets test tightening, 1 January 2017
Looking first at the Age Pension assets test change, it has marooned with significantly reduced living standards a generation of Age Pensioners who worked, saved and retired on the basis of the Simplified Superannuation changes. If the government was attracted to the 2017 Age Pension change, it should have included appropriate grandfathering provisions by preserving the 2007 arrangements for those already retired.
The Coalition government has never explained the 2017 reversal of policy, beyond saying the government needed the revenue, and that it was ‘unfair’ for people who own a house and have generous other assets (up to $1.2 million, as shown in Charts 1 and 2) to access a part pension. The government has merely sent the sound reasoning and evidence behind 2007’s Simplified Superannuation reform to the forgettery.
This policy change goes beyond a commonplace government breach of faith. It is more like fiscal entrapment. In 2007, the then Coalition government said, in effect: “Here are our carefully designed and tested rules, enshrined in law; you can retire at 65 with specified access to the part Age Pension.” In 2017, the later Coalition government said, in effect: “Fooled you! You’re now 75 and out of the workforce, and here is the reduction in retirement living standards the government prescribes for the rest of your life.” People don’t take kindly to being treated this way, and a lesson painfully learned is not readily forgotten: never again trust a government making rules for retirement income.
Superannuation restrictions and tax increases, 1 July 2017
Turning now to the superannuation changes, their consequences will impact on all three ‘superannuation generations’: the retired 60 pluses; the peak saving 40 to 60 year olds; and the 20-40 year old young savers, who are mostly making only superannuation guarantee contributions at this stage of their lives.
- Retirees, or those nearing retirement, with super balances already in the savings trap zone will have strong incentives to reduce balances to increase income by qualifying for a higher part Age Pension. Most likely, their savings will be diverted to a more valuable principal residence, renovations, consumption (such as ‘bucket list’ travel) or gifts (below Age Pension limits).
- These strategies are widely advertised in retirement media and financial adviser circles.
- When a government vastly complicates retirement rules as it has done in 2017, savers and retirees are forced back into the arms of expensive financial advisers, who would be remiss in their professional duties if they did not point out to savers and retirees how to ‘hit the sweet spot’ and maximise their Age Pension entitlements.
- If those with super balances in the savings trap zone instead try by faster drawdown of their super to match the higher income of those successfully accessing a higher part Age Pension, their savings will be exhausted sooner and they will progress to reliance on a bigger (or full) Age Pension earlier than otherwise (Chart 6).
- Those in the 40 to 60 year peak saving period will have strong incentives to spend more current income and save less into super, with that extra spending being either consumption, or spending on durables such as housing and renovations not disadvantaged by the tax system and outside the Age Pension assets test.
- Young savers will review the shambles of the retirement income policy changes in 2015 and 2016, and coast on their super guarantee compulsory minimum savings and either spend according to the incentives provided by the income tax and the Age Pension, or save outside of superannuation in areas of lesser income tax disadvantage, such as negatively geared property.
The government’s imagined short-term gain to revenue will most likely be reduced in the short run, and reversed in the long run. In particular, the 2016 Budget estimate of revenue from the 1 July 2017 superannuation measures will be undershot as people adjust to the savings trap by reducing discretionary superannuation saving effort, and/or moving their superannuation within couples to gain protection from the Budget measures.
There seems little doubt these behavioural adjustments will invalidate the old RIMGROUP projections of Chart 3. The rapid, smooth progression from full to part Age Pension projected earlier, will slow or halt, and the rise (if any) in full retirement self-sufficiency will be even smaller.
8. Where’s the modelling for the 2017 Age Pension and superannuation changes?
The analysis in this article is simple, dealing mostly with the short-run income and behavioural impacts of the perverse, interactive incentives structures enacted separately, and perhaps accidentally, in the 2015 and 2016 Budgets by two different neophyte Treasurers.
As the 2012 RIMGROUP modelling of Chart 3 reminds us, understanding retirement income policy changes demands long-term projections that account for: demographic ageing; the rise in superannuation guarantee rates; the interaction of pension eligibility rules with superannuation rules; the growth in incomes; greater life expectancies at retirement; and the consequences of ultimate recourse to the Age Pension once super savings crimped by the 2017 measures are exhausted.
It is striking that the Coalition government’s presentation of, and advocacy for, its 2017 changes, while running to many dozens of glossy pages, has nowhere published any new long-term modelling to update the RIMGROUP 2012 projections on the sustainability of the retirement income system. That earlier modelling is now most certainly invalidated by the policy changes that took effect in 2017.
To have made the retirement policy changes announced in the 2015 and 2016 Budgets without any published modelling of their long-term effects was to fly blind. It further damages the credibility of the changes themselves, and increases taxpayer concerns that future changes will be necessary, but may be similarly opaque in their justification and evidence, and equally vulnerable to reversal or further change.
Perhaps to explain the absence from public sight of long-term modelling of the 2015 and 2016 retirement income changes taking effect in 2017, in March 2017 Treasury issued a staff paper outlining how it is working on a new retirement income model, MARIA. This model will be a potentially technically superior tool to the RIMGROUP cohort model, using a more detailed microsimulation approach now allowed by better data and more computing power. The modelling team notes:A clear understanding of how retirement income policies affect both the Commonwealth budget and retirement incomes of individual Australians is essential for effective policy development. However, because retirement income policies take decades to mature, it is necessary to model 40 or more years in to the future to fully understand their effects, and this is an intrinsically challenging task. (p 1)
We could not agree more.
In the meantime, our simpler analysis from first principles suggests the retirement income picture is now much less robust and sustainable than after Simplified Superannuation was implemented in 2007. Retirement living standards are unlikely to be as secure, fiscal improvements are highly questionable, confidence in retirement income policy making has been destroyed, and in the newly destabilised retirement income policy system, further unpredictable policy changes are likely budget by budget.
9. Bad processes lead to bad policy
Only a decade ago, Australia was lauded among the advanced economies for the quality of its public policy processes. Good policy processes can’t absolutely guarantee good policies, but they make good outcomes most likely. Any policy mistakes are relatively few, quick to identify and more easily corrected before vast sums are wasted.
More recently, long-standing observers of Australian policy such as Paul Kelly have observed that public policy processes have fallen into disrepair. Good policies may occasionally accidentally emerge from bad processes, but the probability is that bad ideas will be implemented because of poor analysis, lack of a strategic view of the ‘big picture’, lack of publicly available information, and lack of contestable modelling. Not only are bad policies more likely to be advanced in such an impoverished environment, their detection and the prompt limitation of their damage are more difficult. For recent examples, think of the NBN (famously advocated to Prime Minister Rudd on the basis of a sketch on a napkin, rather than a social cost-benefit analysis, as satirised here). Think also of Australian renewable energy policies, and the desperate scramble now to limit their damage, well sketched by the former Productivity Commission Chairman and Chair of ANZSOG, Gary Banks. An equally gruesome case to be played out over decades to come is the very expensive construction of a uniquely modified submarine design.
As we have seen, the 2017 changes to Age Pension and superannuation arrangements fall solidly into this regrettable policy morass.
Save Our Super has argued in its submissions to Treasury on exposure drafts of the superannuation Bills and to the government and the Senate Committee on the Bills that the changes were not supported by evidence or modelling, but were rationalised by unjustified insults to savers who had lawfully followed Parliament’s legislated incentives. The consultation processes were derisory and rushed, and warnings by specialists such as the Institute of Public Accountants and the Australian Institute of Superannuation Trustees of excessive complexity and unresolved problems were clearly not incorporated into revised legislation.
With all the desiderata for good policy making in a complex area met by a Coalition government in 2007 but violated by a later Coalition government in the 2017 retirement income policy changes, there is little wonder the results are unjust, unstable, unsustainable and likely to necessitate still more changes.
10. Overloading a sinking ship
The retirement income system now struggles to meet the complications and perverse incentives introduced in 2017, and must address serious damage to confidence in superannuation and Age Pension rule-making from the Coalition government’s failure to include appropriate grandfathering provisions. Yet the government continues to load the system with new challenges and expectations, all of which rest on the very confidence that has been recently trashed.
Consider superannuation incentives such as creating deferred income products or assisting saving for a first home. If citizens can’t trust the government to respect obligations to those who entrusted their lifetime savings or retirement income to yesterday’s laws, why should they allocate additional savings for a decade or more hence on the basis of today’s laws? The 2016 election saw the Liberals, Labor and the Greens in a chaotic and poorly documented competition to raise more tax from superannuation, which does not augur well for future policy making in this most complex policy area, where mistakes have long-lasting consequences.
11. Getting it right the next time
The retirement income incentives taking effect in 2017 are unsustainable, unstable, and will need further extensive and better-designed change in the near future.
The necessity for further change is itself a disincentive to current super saving and an encouragement to ‘age-pension-first’ strategies. The damage to confidence from the 2017 changes is amplified because their implementation violates a 40-year tradition of including appropriate grandfathering provisions against any significantly adverse policy change to protect those already retired or too close to retirement to make alternative saving arrangements. Savers now rationally fear that future, presently unforeseeable changes necessitated by the design failures of the 2017 changes might also be implemented without grandfathering.
Key directions for future change remain open for considered national debate. Widely different and sometimes contradictory options are commonly advocated for increasing self-funded retirement and ensuring the Age Pension serves as a safety net for those who cannot self-provide rather than, as at present, a foundation and first resort for individual retirement planning.
Options that have been raised by others include, but are not limited to:
- increasing the Superannuation Guarantee (or instead, abolishing it);
- including the value of the principal residence in the Age Pension means test with appropriate safeguards;
- restricting tax-facilitated retirement phase superannuation products to require that they more resemble annuity products. (Such products would have maximum as well as minimum annual drawdowns, ensuring super is applied first to sustained retirement income provision for longer life expectancies, while allowing any residual to pass to the estate of a deceased superannuation saver);
- abandoning superannuation altogether and moving to a national pension scheme, with all that that implies for a socialisation of the retirement income savings sector and creating an enlarged vulnerability to the recent practices of napkin-based, ‘nation-building infrastructure investments’, in which ‘good debt’ is incurred to pump water uphill and other notions yet to be turned into concepts, and later into ideas.
It is only necessary to list such widely different options to see how unsettling they will be to many already retired, to those nearing retirement, and even to young savers compulsorily committed through the superannuation guarantee to the super system.
So the analysis of such ideas, the marshalling of evidence on how they might apply, and a long-term model of what their true impact on retirement incomes and the national budget will be, has to be a foundation to any informed national discussion and choice of a path forward. Such an improved base in public information, analysis and modelling is essential, not just to inform voters, savers and retirees, but also to bring along the opposition and cross-bench parties and independents in an area that is otherwise very vulnerable to panic-mongering.Save Our Super has no position at present on these or other future retirement income options. But we are convinced the failures of the 2017 changes mean more policy change is inevitable.
Better options with lower adjustment costs will emerge, the sooner recent policy mistakes are acknowledged.
The next round of reforms must be better considered than the perverse 2017 changes. Any significantly adverse impacts on those already retired or too close to retirement to change their plans should include appropriate grandfathering provisions. Otherwise, necessary, well-informed debate will not get off the ground.
Appendix A: Assumptions for Charts 1, 2, 4, 5 and 6
The charts are based on a model created by Sean Corbett, B. Comm. (UQ), B.A. Hons in Economics (Cambridge), M.A. (Cambridge). Sean has over 20 years of experience in the Australian superannuation industry, principally in the areas of product management and product development. He has worked at Challenger and Colonial Life, Connelly Temple (the second provider of allocated pensions in Australia) and Oasis Asset Management.
The model captures the key interactions between the superannuation system and the Age Pension under its income and assets tests. It uses illustrative superannuation balances of between $150,000 and $1,500,000, and allows exploration of total incomes enjoyed with various superannuation balances by retirees who are either single or part of a couple, either with or without home ownership. It also allows alternative assumptions about the net real earning rate of superannuation balances, to estimate how long various superannuation balances will last in retirement.
The model is archived and available on request from the authors, who thank Sean for his permission to draw on his work, and for his helpful comments on drafts of this article. The model appears identical in broad approach to the articles by Tony Negline, with slightly different assumptions – for example Negline assumes the married couple have $50,000 in personal use assets (which reduces the headroom under the assets test for superannuation saving), whereas Corbett doesn’t assume any assets subject to assets test except the superannuation balance itself. The Corbett approach illustrates a more continuous array of illustrative savings levels than the Negline articles, to give a more fine-grained picture of likely incentives for adjustment.
Charts 1 and 4 are simply hypothetical illustrative superannuation balances at retirement age of 65 for a couple.
For simplicity in exposition, Charts 2 and 5 present the impact of those illustrative superannuation balances on a couple assumed to own their own home.Their superannuation balance is assumed to be invested in an allocated pension (by far the most popular retirement income product available for superannuation). They are assumed to draw down that pension in an income stream at a rate of 5% a year (this is the minimum required draw-down for someone in the 65-74 age bracket, so the examples in the charts could be interpreted as applying to a couple anywhere in that age range).For purposes of the Age Pension’s income and assets tests, it is assumed the deemed income from the superannuation balance applies and that the couple has no other assets except their superannuation in excess of the assets test limits.
For Chart 6, the superannuation balance is assumed to earn 2% more than the rate of inflation.
The chart illustrates the time taken to exhaust the superannuation balance if withdrawals occur at the rate necessary to enjoy the same total income (superannuation plus any part or full Age Pension) as the maximum total income enjoyed by anyone with a lower or the same superannuation balance. Note that the maximum duration of 25.8 years for the assumed real return above occurs up to the ‘sweet spot’ and for super balances of $1,050,000 and above, with values in between illustrating the ‘savings trap’ of Chart 5. The model uses the simplifying assumption that a retiree in this range matches the highest total income enjoyed by anyone with a lower or the same superannuation balance in year 1, and then draws down at the same rate in real terms going forward. (In the examples used in this paper, the start of the savings trap is case 6 with a superannuation balance of $400,000, a part Age Pension of $32,395 and the 5% minimum superannuation drawdown of $20,000, yielding a combined income of $52,395 per annum.)
About the authors
Jack Hammond: Save Our Super’s founder is Jack Hammond QC, a Victorian barrister for more than three decades. Prior to becoming a barrister, he was an Adviser to Prime Minister Malcolm Fraser, and an Associate to Justice Brennan, then of the Federal Court of Australia. Before that he served as a Councillor on the Malvern City Council (now Stonnington City Council) in Melbourne. During his time at the Victorian Bar, Jack became the inaugural President of the Melbourne community town planning group Save Our Suburbs.
Terrence O’Brien: Terrence O’Brien is a retired senior Commonwealth public servant. He is an honours graduate in economics from the University of Queensland, and has a master of economics from the Australian National University. He worked from the early 1970s in many areas of the Treasury, including taxation policy, fiscal policy and international economic issues. His most senior positions have also included several years in the Office of National Assessments, as senior resident economic representative of Australia at the Organisation for Economic Cooperation and Development, as Alternate Executive Director on the Boards of the World Bank Group, and at the Productivity Commission.
2 pings
[…] « Full article – A retirement income and savings trap caused by the Coalition’s 2017 superannu… […]
[…] The asset test taper rate is unreasonably high, and this is the direct cause of the concern expressed in Issue 2 (c). The issue has been widely discussed, for example see https://saveoursuper.org.au/retirement-income-savings-trap-caused-coalitions-2017-superannuation-age-… […]