
Updated 11 March 2014
Kai Swoboda
Economics
Contents
Introduction
Policy and legislative chronology
Whitlam Government (December 1972–November 1975)
Fraser Government (November 1975–March 1983)
Hawke Government (March 1983–December 1991)
Keating Government (December 1991–March 1996)
Howard Government (March 1996–November 2007)
Rudd Government (November 2007–June 2010)
Gillard Government (June 2010–June 2013)
Rudd Government (June 2013–September 2013)
Superannuation coverage
Accumulated superannuation savings
Age Pension coverage
Attachment 1: Key superannuation coverage statistics, various Australian Bureau of Statistics surveys
Attachment 2: Retirement income policy and legislative chronology
Introduction
The purpose of this chronology of key events is to provide an historical context with which to understand the evolution of superannuation and retirement income policy in Australia. More specifically, the chronology is intended to:
- provide a quick reference guide to what happened and when
- facilitate access to relevant documents and
- complement other sources on changes to retirement income policy by providing an account that focuses on government decisions, reports and legislation.
- The chronology focuses on key events in the development of superannuation and retirement income policy including:
- major milestones and changes relating to the Age Pension
- the development and implementation of mandatory and voluntary retirement income arrangements and
- the development of, and changes to, taxation arrangements applying to superannuation generally.
The number of possible entries in a chronology of this kind is very large. By outlining only key events, the chronology is intended to convey the character of change since 1901. An important criterion in determining whether an event warranted inclusion was whether secondary sources referred to it.
Key changes to the Age Pension arrangements are included in the chronology due to its importance within the retirement income system. The Parliamentary Library has also published a separate, more detailed, chronology of changes to Age Pension arrangements and other support payments which may be of interest in understanding related changes in these areas.[1]
There are some areas that the chronology does not canvass. For example, the development and evolution of Commonwealth and state public sector schemes and military superannuation schemes. There are other areas of superannuation where the chronology needs to be expanded, such as to cover the history of superannuation arrangements for self-employed persons, policies to encourage voluntary contributions, the regulation of ‘excluded superannuation funds’ (the antecedent of self-managed superannuation funds (SMSFs)) and SMSFs.
Policy and legislative chronology
Retirement income and superannuation have been significant themes for the Commonwealth Government since Federation. In common with other countries, Australia’s retirement income system has three component parts or ‘pillars’ as they are known. The first pillar is the social security Age Pension. Compulsory superannuation contributions made under the superannuation guarantee regime is the second pillar. The third pillar is additional private savings, often made through additional voluntary superannuation contributions.[2]
The Age Pension was first introduced by the Commonwealth Government in 1908 and commenced operation from July 1909. An invalid pension (now known as disability support pension) commenced from December 1910. These superseded State-based Age Pension schemes which had been introduced in New South Wales (1900), Victoria (1900) and Queensland (1908) and an invalid pension scheme introduced in New South Wales (1908). While the age at which a person could be eligible for the Age Pension was 65 upon introduction in 1909, this was reduced to 60 years for women in 1910. Recent changes will see the eligibility age for the Age Pension progressively increase to reach 67 years for both males and females on 1 January 2024.
Employer-based superannuation has been a feature of employment in some industries in Australia from the mid-1800s, notably salaried employees in the public service and the financial sector. While a universal mandatory contribution scheme for retirement savings (and also sickness and disability) was considered by a number of governments, including the Bruce Government in 1923 and the Whitlam Government in 1973, it was not until 1992 that a mandatory scheme was introduced through the introduction of the superannuation guarantee.
Some of the key changes to retirement income policy enacted by Australian Governments since 1972 are summarised below. Table A2 in attachment 2 provides detailed references for these and other changes. The statistics quoted for superannuation coverage and level of aggregate superannuation are discussed further below.[3]
Whitlam Government (December 1972–November 1975)
The Whitlam Government had outlined a number of policies prior to the 1972 election including raising the Age Pension to 25 per cent of average male weekly earnings, abolishing the means test and establishing a national superannuation scheme following an inquiry.
In March 1973, the Whitlam Government established the National Superannuation Committee of Inquiry to examine the possibility of a national superannuation scheme. The Committee—chaired by economist Keith Hancock—was given broad terms of reference, including to examine developments overseas. However, only an interim report—described by the Committee as ‘essentially a discussion paper’ was delivered during the term of the Whitlam Government.[4]
Key retirement income changes implemented by the Whitlam Government included the abolition of the means test for the Age Pension for those aged 75 years or more from September 1974. This was extended to those aged 70 to 74 years from May 1975. The Whitlam Government also raised the Age Pension rate sufficiently so that by June 1975 it was to meet the 25 per cent of average male weekly earnings benchmark. However, the benchmark was not reflected in legislation, requiring future legislated increases to maintain this benchmark.
Superannuation coverage reached 29 per cent of employed persons in February 1974.
Fraser Government (November 1975–March 1983)
The final report of the Hancock Committee was delivered to the Fraser Government in April 1976.[5] After some period of consideration, the Fraser Government in July 1979 rejected the Committee’s majority recommendations to establish a partially contributory, universal pension system with an earnings-related supplement. The Fraser Government then established a task force to consider the role of occupational superannuation in providing for retirement and whether there was a need to revise or impose new standards for schemes. The final report from this taskforce was delivered in the last few months of the term of the government (January 1983).[6]
A number of changes to the timing of Age Pension indexation were made during the period of the Fraser Government. Biannual indexation was applied from 1976, which was then changed to annual indexation from 1978 before returning to biannual indexation in 1979. The move to annual indexation was made in response to the ‘reduction in inflation achieved by the government’.[7] A significant change to Age Pension eligibility was made in 1976 with the abolition of the assets test. The Government noted that such a move would provide for ‘a simpler and more easily understood test of eligibility for pensions’.[8]
Superannuation coverage increased from 29 per cent of employed persons in February 1974 to 53 per cent of employed persons in late 1982.
Hawke Government (March 1983–December 1991)
Perhaps the most significant policy announced and implemented by the Hawke Government was the establishment of mandatory superannuation through the superannuation guarantee (SG) scheme—a legislated minimum employer contribution to superannuation for most employees. The SG had as its basis expanding coverage of award-based superannuation through Government and union support in centralised industrial relations arrangements from the mid-1980s.
Other important retirement income measures announced or implemented by the Hawke Government included:
- increase in taxation applied to certain superannuation lump sums from July 1983
- the abolition of the ‘30/20’ rule for investments in government bonds for life companies and superannuation funds from 11 September 1984 and
- the introduction of a tax on superannuation contributions and a reduction in tax on benefits from 1 July 1988.
Sitting as a back bencher in mid-1991, Paul Keating provided an outline of his proposed retirement income system to be based on the Age Pension, augmented by a privately funded and compulsory employment-related national superannuation scheme.
Superannuation coverage increased from 53 per cent of employed persons in late 1982 to 71 per cent of employed persons by November 1991. The pool of accumulated superannuation savings was around $146 billion at the end of 1991, equivalent to 38 per cent of GDP.
Keating Government (December 1991–March 1996)
Legislation to support the introduction of the SG passed the Parliament in 1992, with the rate to progressively increase from 3 per cent for small employers (4 per cent where the employer’s base year payroll was above $1 million) from July 1992 to reach 9 per cent by July 2002.
In the 1995-96 Budget, the then Treasurer outlined the Keating Government’s proposal to further increase superannuation contributions to 15 per cent through both an additional employee and employer contribution.
Other important retirement income measures announced or implemented by the Keating Government included:
- establishing regulatory arrangements in the Superannuation Industry (Supervision) Act 1993, and
- a phased increase in Age Pension eligibility for women from age 60 to age 65 between 1995 and 2004.
Superannuation coverage increased from 71 per cent of employed persons in November 1991 to 81 per cent of employed persons in November 1995. The pool of accumulated superannuation savings rose from around $146 billion at the end of 1991 (equivalent to 38 per cent of GDP) to around $238 billion in early 2006 (equivalent to 46 per cent of GDP).
Howard Government (March 1996–November 2007)
On the election of the Coalition Government in 1996, the then Treasurer announced that the former Government’s 1995–96 Budget proposals for employee and government contributions would be reviewed and that the schedule of employer superannuation guarantee contributions would remain unchanged. The Coalition Government proposed that employees be able to ‘opt out’ by having the opportunity to receive wages or salary instead of superannuation guarantee contributions. This was to commence on 1 July 1998 but was later deferred and then dropped.
One of the significant policies announced by the Howard Government in the 1996 Budget was the introduction of the superannuation surcharge for higher income earners, a measure which was subsequently abolished.[9] Also announced was the creation of the Retirement Savings Account arrangements and income tax rebates for eligible individuals making voluntary superannuation contributions.
The Wallis Financial System Inquiry (May 1996–March 1997) was influential in informing the subsequent changes to superannuation industry regulation by the Australian Prudential Regulation Authority (APRA) and for measures to promote competition between funds, including the establishment of the SMSF arrangements and choice of superannuation fund by employees.
Significant policies announced or implemented by the Howard Government included:
- increasing the superannuation preservation from 55 to 60 on a phased-in basis
- introduction of the superannuation co-contribution arrangements and
- superannuation assets able to be divided between the parties in a marriage breakdown.
The Howard Government’s ‘Simplified Super’ package of measures, announced in the 2006-07 Budget, provided for a range of policies that establish many of the current features of superannuation including the tax rates applicable to contributions and superannuation fund earnings and the tax-free status for some superannuation payments for those aged 60 or more from July 1997.
The Coalition’s pre-election promise to maintain the Age Pension at a benchmark of 25 per cent of average weekly earnings was legislated in 1997. However, rather than rely on increasing rates to meet this benchmark—as had previously been the case—a formal mechanism was introduced so a minimum benchmark of 25 per cent of male total average weekly earnings was automatically maintained.
Superannuation coverage increased for all employees from 90 per cent in November 1995 to 93 per cent in August 2002. Superannuation coverage for employees with their current employer remained around 91 per cent over the period August 2002–August 2007. The pool of accumulated superannuation savings rose from around $238 billion in March 1996 (equivalent to 46 per cent of GDP) to around $1.2 trillion at the end of 2007 (equivalent to 110 per cent of GDP).
Rudd Government (November 2007–June 2010)
The Rudd Government commissioned a number of reviews of various aspects of retirement income arrangements including theHenry tax review (May 2008–December 2009), the Cooper Review of superannuation (May 2009–June 2010) and the Harmer pension review (May 2008–February 2009). The Rudd Government’s response to these reviews underpinned much of its subsequent policies and also influenced changes implemented by the Gillard Government.
Other significant policies announced or implemented by the Rudd Government included:
- phased increase in the rate of the superannuation guarantee from 9 per cent to 12 per cent by July 2018
- increase in the rate of the Age Pension by $30 per week for single people. The 25 per cent of average weekly earnings was adjusted to 27.7 per cent for single people and 41.76 per cent for couples. A new prices measure called the Pensioner and Beneficiary Living Cost Index (PBLCI) was added to the pension indexation process, which will be used if the increase in the PBLCI is greater than that for the CPI
- the qualifying age for the Age Pension will increase by six months every two years from July 2017 until it reaches 67 years of age on 1 January 2024 and
- removal of same-sex discrimination from Acts governing Commonwealth superannuation schemes.
Superannuation coverage for employees with their current employer fell from 91 per cent in August 2007 to 90 per cent in August 2010. The pool of accumulated superannuation savings fell from around $1.2 trillion in December 2007 to a low of $993 billion in March 2009 (equivalent to 80 per cent of GDP) before recovering to $1.2 trillion by June 2010 (equivalent to 94 per cent of GDP).
Gillard Government (June 2010–June 2013)
One of the major changes to retirement income policy during the Gillard Government was to legislate the incremental increase to the superannuation guarantee charge from 9 per cent at July 2012 to 12 per cent by July 2019.
A number of changes and proposed changes to superannuation arrangements during the period of the Gillard Government were based on arguments that support for superannuation—whether direct or through tax concessions—needed to be ‘fairer’ or ‘more sustainable’. These included the implementation of a government superannuation contribution of a maximum of $500 implemented from 1 July 2013 for those earning $37,000 or less (offset by tighter eligibility and lower payments under the superannuation co-contribution), imposing an additional tax on certain superannuation contributions for those earning more than $300,000 and an announcement to cap the tax exemption for earnings on superannuation assets supporting income streams at $100,000, with a concessional tax rate of 15 per cent applying thereafter.
The Government’s response to the Cooper Review of Superannuation has also required a range of legislative changes to implement the ‘MySuper’ and ‘Superstream’ package of measures.
Other significant policies announced or implemented by the Gillard Government included:
- changed default superannuation fund arrangements in modern awards
- broader reporting of superannuation fund contributions by funds and employers to employees and
- strengthened arrangements for the regulation and investments of SMSFs.
The Gillard Government’s own assessment of its accomplishments in superannuation claimed that superannuation changes would boost the national pool of superannuation savings by more than $500 billion by 2037 and give a 30 year old, on average wages, an additional $127,000 in their retirement.[10]
Superannuation coverage for employees with their current employer remained at around 90 per cent between August 2010 and August 2012. The pool of accumulated superannuation increased from $1.2 trillion in June 2010 (equivalent to 94 per cent of GDP) to $1.6 trillion in June 2013 (equivalent to 107 per cent of GDP).
Rudd Government (June 2013–September 2013)
There were only limited superannuation policy announcements during the short period in which the second Rudd Government was in power. The Rudd Government’s announcement about the establishment of a legislatively-backed ‘Council of Superannuation Custodians’ that would assess changes to the superannuation system against the principles of certainty, adequacy, fairness and fiscal sustainability was argued to be a way to provide for greater certainty and confidence in the superannuation system.[11]
This announcement was followed by a policy that the Government would make no ‘major changes to superannuation policy for five-year periods’.
Key statistics
Key statistics for retirement income in Australia include the extent to which the working population is covered by superannuation, the aggregated scale of accumulated superannuation savings and reliance on the Age Pension. The long-term statistics for these measures may not necessarily be directly comparable over time so they need to be interpreted with caution. Table A1 in attachment 1 provides details of these statistics.
Superannuation coverage
A number of regular and irregular surveys by the Australian Bureau of Statistics (ABS) give an indication of how widespread superannuation is as a condition of employment across different groups. Comparisons of these results over time needs to take into account survey coverage, definitional issues and changes in reported results.
While there are some discontinuities in statistics about superannuation coverage for different groups over time, the following general points can be made:
- the period from the implementation of award-based superannuation (mid 1980s) saw the acceleration of superannuation coverage in the labour force and amongst employees, with the implementation of the SG leading to a continued increase in coverage, albeit at a slower rate (figure 1)
- differences in superannuation coverage that were apparent between specific groups such as public/private sector and males/females in 1974 were largely ameliorated by 2011, and
- coverage has increased the most over the period 1974–2011 for groups who were typically outside of male dominated, union dominated industries.
Figure 1: Superannuation coverage, various measures, 1974 to 2012 (per cent)
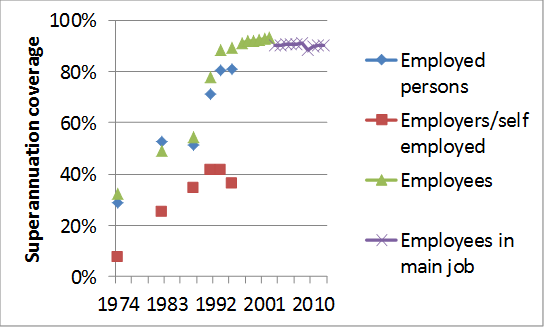
Source: Attachment 1, Table A1.
Superannuation coverage for females has increased from well below that for males in the 1970s to exceed that for men in recent years (figure 2).
Figure 2: Superannuation coverage for males and females, various measures, 1974 to 2012 (per cent)
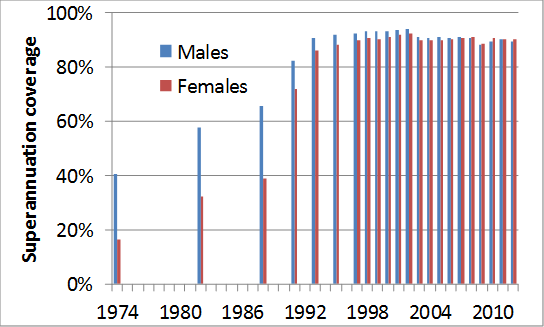
Note: Comparisons between males and females over the period are based on different measures such as ‘employed persons’ and ‘employees’. Therefore caution needs to be used in making direct comparisons across some years.
Source: Attachment 1, Table A1.
More specific information about measures included in the various surveys conducted by the Australian Bureau of Statistics is included in Table A1 in Attachment 1.
Accumulated superannuation savings
There has been significant growth in total superannuation savings (including savings managed by SMSFs) both in terms of the value of savings and as a share of GDP since the late 1980s (figures 3 and 4).[12]
Figure 3: Accumulated superannuation savings, June 1988 to December 2013 ($ billion)
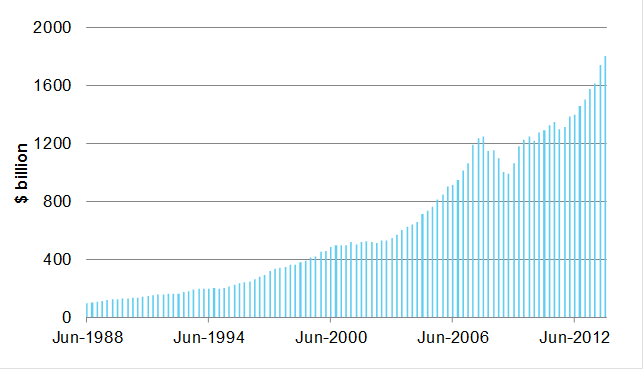
Source: Parliamentary Library estimates based on Treasury methodology using Australian Prudential Regulation Authority (Quarterly superannuation performance, various issues) and Australian Bureau of Statistics (Australian National Accounts: National Income, Expenditure and Product, various issues).
Figure 4: Accumulated superannuation savings as a share of GDP, June 1988 to December 2013 (per cent)
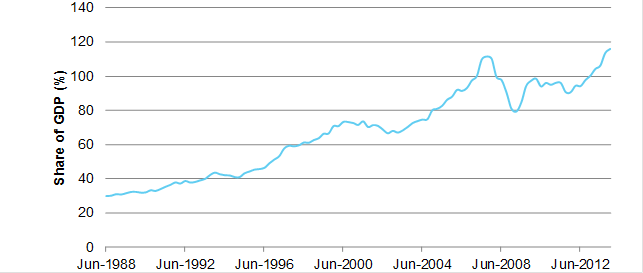
Source: Parliamentary Library estimates based on Treasury methodology using Australian Prudential Regulation Authority and Australian Bureau of Statistics data.
Age Pension coverage
The number of people receiving the Age Pension has increased significantly since 1910, growing from around 100,000 people in 1910 to around 2.3 million in June 2012 (figure 5). In June 2012, females accounted for around 56 per cent of Age Pension recipients, a share which has steadily fallen from a high of 70 per cent in the mid-1960s.[13]
Figure 5 Number of age pensioners by sex, 1910 to 2012 (‘000)

Source: Parliamentary estimates based on Department of Social Services, Income support customers: a statistical overview 2012, Statistical Paper No. 11, January 2014, p. 4, accessed 31 January 2014; Department of Family and Community Services (2000): Income Support Annual Database, Edition 1.0. Available on CD.
Take-up rates for the Age Pension (the number of people receiving the Age Pension as a proportion of the population of Age Pension age) reached a peak of almost 80 per cent in the late 1970s and has remained at around 65 per cent in the last decade (figure 6). Take-up rates for the Age Pension were generally similar for males and females until the mid-1930s. After this period, take-up rates for males were lower for females, with the gap at its highest in the early 1990s before narrowing in the last decade.
Figure 6: Age Pension take-up rate by sex, 1910 to 2012 (per cent)
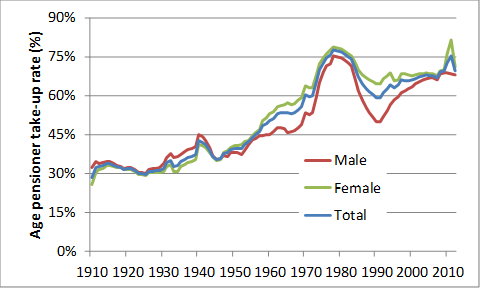
Note: Some people of Age Pension age may be in receipt of a service pension rather than Age Pension. As a result the Age Pension take up rate understates the proportion of the population in support of pension benefits (particularly for males during the period 1940 to the mid 1990s).
Source: Parliamentary estimates based on Department of Social Services, Income support customers: a statistical overview 2012, Statistical Paper No. 11, January 2014, p. 4, accessed 31 January 2014; Department of Family and Community Services (2000): Income Support Annual Database, Edition 1.0. Available on CD; Australian Bureau of Statistics, Australian Demographic Statistics, March 2013, cat. no. 3101, ABS, Canberra, September 2013, cat. no. 3101, Table 59. Estimated Resident Population By Single Year Of Age, Australia, accessed 5 December 2013.
Attachment 1: Key superannuation coverage statistics, various Australian Bureau of Statistics surveys
Table A1: Key superannuation coverage statistics, various Australian Bureau of Statistics surveys, 1968–2012
| Year | Comments on superannuation coverage | Source Documents |
|---|---|---|
| May 1968 | Australian Bureau of Statistics conducted a survey for Victoria only of superannuation coverage.
35.1 per cent of employed wage and salary earners were covered by superannuation. Coverage for male wage and salary earners by industry ranged from 80.8 per cent in the public authority activities (not elsewhere included) industry to 21.3 per cent in the agriculture and primary industries.[14] Coverage for male employed wage and salary earners was 44.4 per cent compared to 13.6 per cent for female employed wage and salary earners. Coverage for employed wage and salary earners in the government sector was 62.3 per cent compared to 27.6 per cent in the private sector. |
Survey of Superannuation, Victoria, May 1968, Reference no. 6.42, April 1969 (pp. 3, 5 – 6)[15] |
| February 1974 | Australian Bureau of Statistics conducted the first national survey of superannuation coverage.
28.7 per cent of employed persons were covered by superannuation. For wage and salary earners 32.2 per cent were covered by superannuation compared to 7.8 per cent ofemployers and self-employed. Coverage for employed persons by industry ranged from 71.5 per cent in the public administration and defence industry to 5.9 per cent in the agriculture and primary industries. Coverage for wage and salary earners by industry ranged from 71.5 per cent in the public administration and defence industry to 6.9 per cent in the agriculture and primary industries. Coverage for wage and salary earners in the government sector was 57.5 per cent and 23.9 per cent in the private sector. Coverage for male wage and salary earners was 40.8 per cent and 16.5 per cent for female wage and salary earners. |
Survey of Superannuation, 1974, Reference no. 6.42, February 1975 (pp. 6, 8 – 9).[16]
Selected summary statistics published in1301.0 – Year Book Australia, 1974 |
| September to November 1982 | 52.7 per cent of all employed persons were covered by superannuation.[17] For employees, 48.9 per cent were covered by superannuation compared to 25.3 per cent ofemployers and self employed.
Coverage for employed persons by industry ranged from 87.9 per cent in the communications industry to 16 per cent in the recreation, personal and other services industry. Coverage for employees by industry ranged from 88.1 per cent in the communications industry to 17.3 per cent in the recreation, personal and other services industry. Coverage for employees in the government sector was 69.4 per cent and 39.1 per cent in the private sector. Coverage for male employees was 57.5 per cent and 32.2 per cent for female employees. |
Superannuation Australia, September – November 1982, cat. no. 6319.0, July 1984, (pp. 12, 15). |
| November 1988 | 51.3 per cent of all employed persons covered by superannuation.[18] For employees, 54.5 per cent were covered by superannuation compared to 34.3 per cent ofemployers and self employed/unpaid family helpers.
Coverage for employed persons by industry ranged from 86.6 per cent in the communications industry to 26.4 per cent in the recreation, personal and other services industry.[19] Coverage for employees in the public sector was 71.9 per cent and 47.7 per cent in the private sector. Coverage for male employees was 65.7 per cent and 39 per cent for female employees. Coverage for employees who were union members was 72.9 per cent and 41.4 per cent for employees who were not union members. Coverage for employees who were permanent was 62.6 per cent and 18.3 per cent for casual employees. Coverage for full-time employees was 61.7 per cent and 20 per cent for part-time employees. |
Superannuation Australia, November 1988, cat. no. 6319.0, April 1989, (pp. 8, 15, 19).
Selected summary statistics in Australian Social Trends 1995 ABS Cat 4102.8 (p. 120) |
| November 1991 | 71.2 per cent of all employed persons covered by superannuation. For employees, 77.6 per cent were covered by superannuation compared to 41.7 per cent of employers and self employed.
Coverage for employed persons by industry ranged from 94 per cent in the communications industry to 44.3 per cent in the agriculture and primary industries. Coverage for employees by industry ranged from 94.7 per cent in the communications industry to 55.7 per cent in the recreation, personal and other services industry. Coverage for employees in the public sector was 88.9 per cent and 73.3 per cent in the private sector. Coverage for male employees was 82.1 per cent and 71.8 per cent for female employees. Coverage for employees who were union members was 90.5 per cent and 69.2 per cent for employees who were not union members. Coverage for employees who were permanent was 87.1 per cent and 39.2 per cent for casual employees. Coverage for full-time employees was 84.8 per cent and 49.8 per cent for part-time employees. |
Superannuation Australia, November 1991, cat. no. 6319.0, May 1992, (pp. 8, 15, 19). |
| November 1993 | 80.5 per cent of all employed persons were covered by superannuation. For employees, 88.5 per cent were covered by superannuation compared to 41.7 per cent of employers and self employed.
Coverage for employed persons by industry ranged from 97.9 per cent in the utilities industries to 55 per cent in the agriculture and primary industries. Coverage for employees by industry ranged from 97.9 per cent in the utilities industries to 75.9 per cent in the recreation, personal and other services industry. Coverage for employees in the public sector was 94.5 per cent and 86.3 per cent in the private sector. Coverage for male employees was 90.5 per cent and 86 per cent for female employees. Coverage for employees who were union members was 95.9 per cent and 83.9 per cent for employees who were not union members. Coverage for employees who were permanent was 95.3 per cent and 63.8 per cent for casual employees. Coverage for full-time employees was 93.2 per cent and 70.9 per cent for part-time employees. |
Superannuation, Australia, November 1993, cat no. 6319.0, June 1994, (pp. 5, 10-11, 14- 16).
Selected summary statistics published inAustralian Social Trends, 1995 , cat. no. 4102.3, (pp. 120–122). |
| August 1995 | Coverage for all employees was 88 per cent.
Coverage for full-time employees was 96.3 per cent and part-time employees was 76.3 per cent. Coverage for employees in the public sector was 93.4 per cent and 86.2 per cent in the private sector. Coverage for male employees was 92.1 per cent and 88 per cent for female employees. |
Weekly earnings of employees (distribution), Australia, August 1995, cat. no 6310.0, February 1996, (pp. 26-27)[20] |
| November 1995 | 80.9 per cent of all employed persons were covered by superannuation. For employees, 89.4 per cent were covered by superannuation compared to 36.1 per cent of employers and self employed.
Coverage for employed persons by industry ranged from 98.7 per cent in the utilities industries to 50.1 per cent in the agriculture and primary industries. Coverage for employees by industry ranged from 98.7 per cent in the utilities industries to 77.2 per cent in the agriculture and primary industries. Coverage for employees in the public sector was 94.5 per cent and 87.7 per cent in the private sector. Coverage for male employees was 91.1 per cent and 87.2 per cent for female employees. Coverage for employees who were union members was 97.4 per cent and 85 per cent for employees who were not union members. Coverage for employees who were permanent was 97.1 per cent and 65.2 per cent for casual employees. Coverage for full-time employees was 94.4 per cent and 71.6 per cent for part-time employees. |
Superannuation, Australia, November 1995, cat no. 6319.0, May 1996, (pp. 6, 14-15, 18-19).
Selected summary statistics published inAustralian Social Trends, cat.no. 4102.8, June 1995, (pp. 120–122) |
| August 1997 | Coverage for all employees was 91.1 per cent.
Coverage for full-time employees was 96.3 per cent and part-time employees was 78.9 per cent. Coverage for employees in the public sector was 96.4 per cent and 89.7 per cent in the private sector. Coverage for male employees was 92.3 per cent and 89.6 per cent for female employees. |
Weekly earnings of employees (distribution), Australia, August 1997, cat. no 6310.0, January 1998, (pp. 36-37). |
| August 1998 | Coverage for all employees was 92 per cent.
Coverage for full-time employees was 97 per cent and part-time employees was 81.1 per cent. Coverage for employees in the public sector was 97 per cent and 81.1 per cent in the private sector. Coverage for male employees was 93.1 per cent and 90.7 per cent for female employees. |
Weekly earnings of employees (distribution), Australia, August 1998, cat. no 6310.0, December 1998 (pp. 36-37). |
| August 1999 | Coverage for all employees was 91.7 per cent.
Coverage for full-time employees was 97 per cent and part-time employees was 80.8 per cent. Coverage for employees in the public sector was 97.3 per cent and 90.4 per cent in the private sector. Coverage for male employees was 93.2 per cent and 90.2 per cent for female employees. |
Employee earnings, benefits and trade union membership, Australia, August 1999, cat. no. 6310.0, February 2000, (pp. 38-41)[21] |
| June 2000 | 86.7 per cent of all pre-retired persons aged 15 to 69 in the labour force covered by superannuation.[22]
Coverage for pre-retired job holders aged 15 to 69 by industry ranged from 100 per cent in the utilities industries to 72.1 per cent in the agriculture and primary industries.[23] Coverage for pre-retired job holders aged 15 to 69 in the public sector was 97.6 per cent and 84.7 per cent in the private sector. Coverage for male pre-retired job holders aged 15 to 69 was 88.1 per cent and 85.7 per cent for females. Coverage for full-time employed pre-retired persons aged 15 to 69 was 91.8 per cent and 63.3 per cent for those working part-time. |
Superannuation: Coverage and financial characteristics, Australia, June 2000, cat. no. 6360.0, September 2001, (pp. 13, 19 and 22). |
| August 2000 | Coverage for all employees was 92.2 per cent.
Coverage for full-time employees was 97.5 per cent and part-time employees was 81.5 per cent. Coverage for employees in the public sector was 97.5 per cent and 91 per cent in the private sector. Coverage for male employees was 93.1 per cent and 91.2 per cent for female employees. |
Employee earnings, benefits and trade union membership, Australia, August 2000, cat. no. 6310.0, March 2001, (pp. 31-32). |
| August 2001 | Coverage for all employees was 92.7 per cent.
Coverage for full-time employees was 96.4 per cent and part-time employees was 82.8 per cent. Coverage for employees in the public sector was 97.9 per cent and 91.6 per cent in the private sector. Coverage for male employees was 93.3 per cent and 91.9 per cent for female employees. |
Employee earnings, benefits and trade union membership, Australia, August 2001, cat. no. 6310.0, February 2002, (pp. 31-32) |
| August 2002 | Coverage for all employees was 93 per cent.
Coverage for full-time employees was 97.7 per cent and part-time employees was 83.6 per cent. Coverage for employees in the public sector was 98.1 per cent and 91.9 per cent in the private sector. Coverage for male employees was 93.8 per cent and 92.2 per cent for female employees. |
Employee earnings, benefits and trade union membership, Australia, August 2002, cat. no. 6310.0, March 2003, (pp. 32-33) |
| August 2003 | Coverage for all employees with their current employer was 90.2 per cent.
Coverage for full-time employees with their current employer was 96 per cent and part-time employees with their current employer was 76.4 per cent. Coverage for employees with their current employer in the public sector was 97.5 per cent and 88.5 per cent in the private sector. Coverage for male employees with their current employerwas 90.8 per cent and 89.6 per cent for female employees with their current employer. |
Employee earnings, benefits and trade union membership, Australia, August 2003, cat. no. 6310.0, March 2004, (p. 36).[24] |
| August 2004 | Coverage for all employees with their current employer was 90.1 per cent.
Coverage for full-time employees with their current employer was 95.7 per cent and part-time employees with their current employer was 76.7 per cent. Coverage for employees with their current employer in the public sector was 97.1 per cent and 88.5 per cent in the private sector. Coverage for male employees with their current employerwas 90.4 per cent and 89.6 per cent for female employees with their current employer. |
Employee earnings, benefits and trade union membership, Australia, August 2004, cat. no. 6310.0, March 2005, (p. 35). |
| August 2005 | Coverage for all employees with their current employer was 90.4 per cent.
Coverage for full-time employees with their current employer was 95.6 per cent and part-time employees with their current employer was 78.2 per cent. Coverage for employees with their current employer in the public sector was 97.5 per cent and 88.8 per cent in the private sector. Coverage for male employees with their current employerwas 91.1 per cent and 89.6 per cent for female employees with their current employer. |
Employee earnings, benefits and trade union membership, Australia, August 2005, cat. no. 6310.0, March 2006, (p. 36). |
| August 2006 | Coverage for all employees with their current employer was 90.4 per cent.
Coverage for full-time employees with their current employer was 95.4 per cent and part-time employees with their current employer was 78.5 per cent. Coverage for employees with their current employer in the public sector was 97.6 per cent and 88.7 per cent in the private sector. Coverage for male employees with their current employerwas 90.7 per cent and 90 per cent for female employees with their current employer. |
Employee earnings, benefits and trade union membership, Australia, August 2006, cat. no. 6310.0, April 2007, (p. 34). |
| August 2007 | Coverage for all employees with their current employer was 90.6 per cent.
Coverage for full-time employees with their current employer was 95.5 per cent and part-time employees with their current employer was 79 per cent. Coverage for employees with their current employer in the public sector was 97.2 per cent and 89.1 per cent in the private sector. Coverage for male employees with their current employerwas 90.8 per cent and 90.5 per cent for female employees with their current employer. |
Employee earnings, benefits and trade union membership, Australia, August 2007, cat. no. 6310.0, April 2008, (pp. 29-30). |
| August 2008 | Coverage for all employees with their current employer was 90.8 per cent.
Coverage for full-time employees with their current employer was 95.4 per cent and part-time employees with their current employer was 79.5 per cent. Coverage for employees with their current employer in the public sector was 97.6 per cent and 89.2 per cent in the private sector. Coverage for male employees with their current employerwas 90.7 per cent and 90.9 per cent for female employees with their current employer. |
Employee earnings, benefits and trade union membership, Australia, August 2008, cat. no. 6310.0, April 2009, (pp. 28-29). |
| August 2009 | Coverage for all employees with their current employer was 88.4 per cent.
Coverage for full-time employees with their current employer was 93.8 per cent and part-time employees with their current employer was 76.2 per cent. Coverage for employees with their current employer in the public sector was 96.5 per cent and 86.6 per cent in the private sector. Coverage for male employees with their current employerwas 88.2 per cent and 88.6 per cent for female employees with their current employer. |
Employee earnings, benefits and trade union membership, Australia, August 2009, cat. no. 6310.0, May 2010, (pp. 26-27). |
| August 2010 | Coverage for all employees with their current employer was 89.8 per cent.
Coverage for full-time employees with their current employer was 94.4 per cent and part-time employees with their current employer was 79.2 per cent. Coverage for employees with their current employer in the public sector was 96.8 per cent and 88.5 per cent in the private sector. Coverage for male employees with their current employerwas 89.3 per cent and 90.4 per cent for female employees with their current employer. |
Employee earnings, benefits and trade union membership, Australia, August 2010, cat. no. 6310.0, May 2011, (pp. 26–27). |
| August 2011 | Coverage for all employees with their current employer was 90.1 per cent.
Coverage for full-time employees with their current employer was 94.6 per cent and part-time employees with their current employer was 79.9 per cent. Coverage for employees with their current employer in the public sector was 96.8 per cent and 88.8 per cent in the private sector. Coverage for male employees with their current employerwas 90 per cent and 90.3 per cent for female employees with their current employer. |
Employee earnings, benefits and trade union membership, Australia, August 2011, cat. no. 6310.0, April 2012, (pp. 28-29) |
| August 2012 | Coverage for all employees with their current employer was 89.9 per cent.
Coverage for full-time employees with their current employer was 94.1 per cent and part-time employees with their current employer was 80.2 per cent. Coverage for employees with their current employer in the public sector was 97.4 per cent and 88.3 per cent in the private sector.Coverage for male employees with their current employerwas 89.5 per cent and 90.3 per cent for female employees with their current employer. |
Employee earnings, benefits and trade union membership, Australia, August 2012, cat. no. 6310.0, May 2013, (p. 29). |
[1]. D Daniels, Social security payments for the aged, people with disabilities and carers 1901 to 2010, Parliamentary Library Background note, 21 February 2011, accessed 16 October 2013.
[2]. In 2011, the then Minister for Financial Services and Superannuation suggested there are four pillars that ‘assure a quality of Australian life for all our fellow citizens: the minimum wage; the age pension; Medicare; and compulsory superannuation’ and that the recently announced National Disability Insurance Scheme has the potential to be the new fifth pillar (B Shorten, ‘Second reading speech: Superannuation Guarantee (Administration) Amendment Bill 2011’, House of Representatives, Debates, 2 November 2011, p. 12420, accessed 16 October 2013.
[3]. Statistics on superannuation coverage usually differentiate between different types of employment arrangements including employees, employed persons and self employed. As coverage can vary significantly for different types of employment, it is important to be specific about the group being referred to. Statistics cited in this section on the estimated value of superannuation savings include those of institutional superannuation funds and SMSFs. As statistics on superannuation assets can sometimes include or exclude different types of superannuation funds, care needs to be taken when using such statistics.
[4] . Interim report of the National Superannuation Committee of Inquiry, June 1974, accessed 16 October 2013.
[5] . National Superannuation Committee of Inquiry, A national superannuation scheme for Australia: final report. Part one, April 1976; Occupational superannuation in Australia: final report of the National Superannuation Committee of Inquiry. Part two, March 1977, accessed 16 October 2013.
[6] . Commonwealth Task Force on Occupational Superannuation, Final report, 1983.
[7] . R Hunt, ‘Second reading speech: Social Services Amendment Bill 1978’, House of Representatives, Debates, 28 September 1978, accessed 22 October 2013.
[8]. K Newman, ‘Second reading speech: Social Services Amendment Bill (No. 3) 1978, House of Representatives, Debates, 7 October 1976, accessed 22 October 2013.
[9] P Costello (Treasurer), Superannuation reform, media release, 20 August 1996, accessed 22 October 2013.
[10] . B Shorten (Minister for Financial Services and Superannuation), Super Bills pass Parliament and mark completion of reform agenda, media release, 25 June 2013, accessed 23 October 2013.
[11] . B Shorten (Minister for Financial Services and Superannuation), Address to FSC Parliamentary function, speech, Canberra, 18 June 2013, accessed 23 October 2013.
[12]. The data for figures 3 and 4 are based on a methodology established by the as part of a paper presented at the 2011 Economic and Social Outlook Conference on 1 July 2011 and published as ‘Compulsory superannuation and national saving’,Economic Roundup, 3, 2011, pp. 45–56, accessed 25 October 2013.
[13]. Department of Families, Housing, Community Services and Indigenous Affairs, Income support customers: a statistical overview 2011, Statistical Paper No. 10, July 2012, p. 5, accessed 5 December 2013; Department of Family and Community Services (2000): Income Support Annual Database, Edition 1.0. Available on CD.
[14]. Industry results for females were not published.
[15]. The survey was based on persons aged 21 years and over with some exclusions (such as defence force members and patients in hospitals) and covered wage and salary earners only, who were defined as those who during the specified survey period did any work for an employer for wages, salary, kind, etc. or had a wage or salary job but was not at work for a number of specified reasons including illness, holiday and industrial dispute. There was differentiation between full-time and part-time.
[16]. The survey was based on persons aged 15 years and over with some exclusions (such as defence force members and patients in hospitals). Full-time workers were those who worked 35 hours a week or more in the survey week with part-time workers working below 35 hours per week in the survey week.
[17]. For the purposes of this survey ‘employed’ was defined as a person aged 15 years and over who usually worked 20 hours of more each week in their main job. As a result, there is no differentiation between full-time and part-time employment.
[18]. For the purposes of this survey ‘employed’ was defined as a person aged 15 to 74 who during the reference week for the survey generally worked for one hour or more for pay. Full-time employment was defined to be those who usually worked 35 hours or more per week.
[19]. The ABS did not publish a separate figure for ‘employees’ by industry in this year so a figure for coverage for employees only is unavailable.
[20]. The survey was carried out as part of the then monthly labour force survey. Questions about superannuation were included in this survey from 1995. In this survey, employees were defined as employed persons aged 15 years and over who worked for an employer for wages or salary or in their own business (with or without employees), if that business was a limited liability company. Separate statistics for coverage by industry were unreliable for some industries and are therefore not included. Superannuation coverage relates to the employee’s main job only.
[21]. The title of this publication was modified but largely carries on from the previous employee earnings publication (the catalogue number. remained unchanged).
[22]. This survey was based on persons aged 15 to 69 and focussed on two main cohorts – pre-retired and retired. As a result, results are not directly comparable to previous surveys.
[23]. The term ‘job holder’ excludes persons who were contributing family members and employees who worked for payment in kind in their main job only.
[24]. This survey did not separately publish results for superannuation coverage provided to employees other than by their current employer.
For copyright reasons some linked items are only available to members of Parliament.
Commonwealth of Australia
![]()
Creative Commons
With the exception of the Commonwealth Coat of Arms, and to the extent that copyright subsists in a third party, this publication, its logo and front page design are licensed under a Creative Commons Attribution-NonCommercial-NoDerivs 3.0 Australia licence.
In essence, you are free to copy and communicate this work in its current form for all non-commercial purposes, as long as you attribute the work to the author and abide by the other licence terms. The work cannot be adapted or modified in any way. Content from this publication should be attributed in the following way: Author(s), Title of publication, Series Name and No, Publisher, Date.
To the extent that copyright subsists in third party quotes it remains with the original owner and permission may be required to reuse the material.
Inquiries regarding the licence and any use of the publication are welcome to webmanager@aph.gov.au.
This work has been prepared to support the work of the Australian Parliament using information available at the time of production. The views expressed do not reflect an official position of the Parliamentary Library, nor do they constitute professional legal opinion.
Any concerns or complaints should be directed to the Parliamentary Librarian. Parliamentary Library staff are available to discuss the contents of publications with Senators and Members and their staff. To access this service, clients may contact the author or the Library‘s Central Entry Point for referral.