Retirement income and superannuation have been significant themes for the Commonwealth Government since Federation. In common with other countries, Australia’s retirement income system has three component parts or ‘pillars’ as they are known. The first pillar is the social security Age Pension. Compulsory superannuation contributions made under the superannuation guarantee regime is the second pillar. The third pillar is additional private savings, often made through additional voluntary superannuation contributions.
Employer-based superannuation has been a feature of employment in some industries in Australia from the mid-1800s, notably salaried employees in the public service and the financial sector. It was not until 1992 that a mandatory scheme was introduced through the introduction of the superannuation guarantee.
Perhaps the most significant policy announced and implemented by the Hawke Government was the establishment of mandatory superannuation through the superannuation guarantee (SG) scheme—a legislated minimum employer contribution to superannuation for most employees. The SG had as its basis expanding coverage of award-based superannuation through Government and union support in centralised industrial relations arrangements from the mid-1980s.
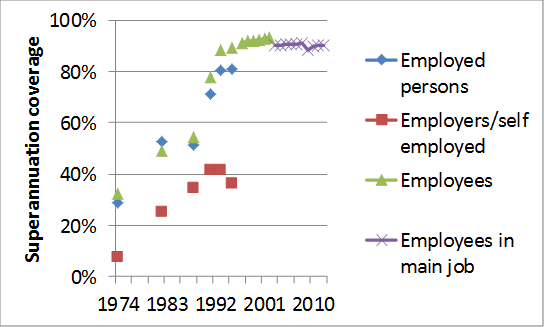
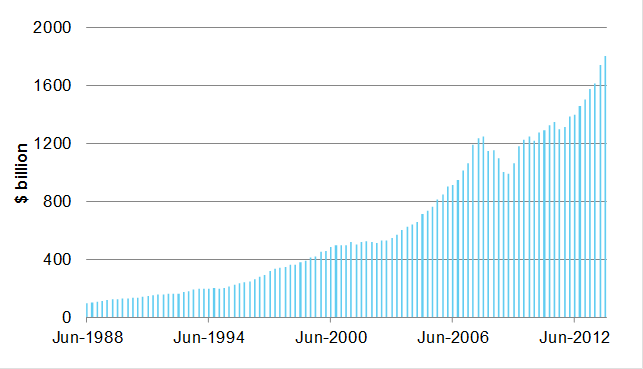
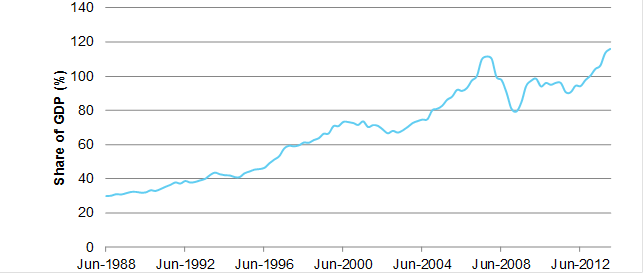
Superannuation coverage increased from 71 per cent of employed persons in November 1991 to 81 per cent of employed persons in November 1995. The pool of accumulated superannuation savings rose from around $146 billion at the end of 1991 (equivalent to 38 per cent of GDP) to around $238 billion in early 2006 (equivalent to 46 per cent of GDP).
The Howard Government’s ‘Simplified Super’ package of measures, announced in the 2006-07 Budget, provided for a range of policies that establish many of the current features of superannuation including the tax rates applicable to contributions and superannuation fund earnings and the tax-free status for some superannuation payments for those aged 60 or more from July 1997.
Superannuation coverage increased for all employees from 90 per cent in November 1995 to 93 per cent in August 2002. Superannuation coverage for employees with their current employer remained around 91 per cent over the period August 2002–August 2007. The pool of accumulated superannuation savings rose from around $238 billion in March 1996 (equivalent to 46 per cent of GDP) to around $1.2 trillion at the end of 2007 (equivalent to 110 per cent of GDP).
Superannuation coverage for employees with their current employer fell from 91 per cent in August 2007 to 90 per cent in August 2010. The pool of accumulated superannuation savings fell from around $1.2 trillion in December 2007 to a low of $993 billion in March 2009 (equivalent to 80 per cent of GDP) before recovering to $1.2 trillion by June 2010 (equivalent to 94 per cent of GDP).
A number of changes and proposed changes to superannuation arrangements during the period of the Gillard Government were based on arguments that support for superannuation—whether direct or through tax concessions—needed to be ‘fairer’ or ‘more sustainable’. These included the implementation of a government superannuation contribution of a maximum of $500 implemented from 1 July 2013 for those earning $37,000 or less (offset by tighter eligibility and lower payments under the superannuation co-contribution), imposing an additional tax on certain superannuation contributions for those earning more than $300,000 and an announcement to cap the tax exemption for earnings on superannuation assets supporting income streams at $100,000, with a concessional tax rate of 15 per cent applying thereafter
Superannuation coverage for employees with their current employer remained at around 90 per cent between August 2010 and August 2012. The pool of accumulated superannuation increased from $1.2 trillion in June 2010 (equivalent to 94 per cent of GDP) to $1.6 trillion in June 2013 (equivalent to 107 per cent of GDP).
Key statistics for retirement income in Australia include the extent to which the working population is covered by superannuation. Table A1 in attachment 1 provides details of these statistics.
Figure 1: Superannuation coverage, various measures, 1974 to 2012 (per cent)

Source: Attachment 1, Table A1.
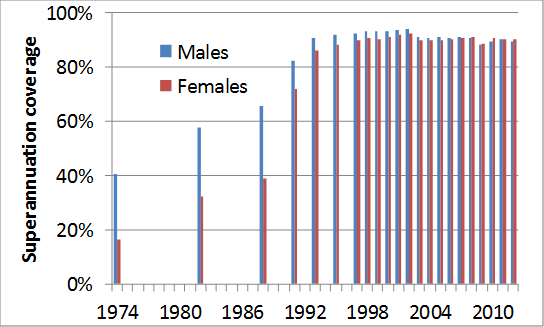
Superannuation coverage for females has increased from well below that for males in the 1970s to exceed that for men in recent years (figure 2).
Figure 2: Superannuation coverage for males and females, various measures, 1974 to 2012 (per cent)

Note: Comparisons between males and females over the period are based on different measures such as ‘employed persons’ and ‘employees’. Therefore caution needs to be used in making direct comparisons across some years.
Source: Attachment 1, Table A1.
More specific information about measures included in the various surveys conducted by the Australian Bureau of Statistics is included in Table A1 in Attachment 1.
Accumulated superannuation savings
There has been significant growth in total superannuation savings (including savings managed by SMSFs) both in terms of the value of savings and as a share of GDP since the late 1980s (figures 3 and 4).[12]

Source: Parliamentary Library estimates based on Treasury methodology using Australian Prudential Regulation Authority (Quarterly superannuation performance, various issues) and Australian Bureau of Statistics (Australian National Accounts: National Income, Expenditure and Product, various issues).
Figure 4: Accumulated superannuation savings as a share of GDP, June 1988 to December 2013 (per cent)

Source: Parliamentary Library estimates based on Treasury methodology using Australian Prudential Regulation Authority and Australian Bureau of Statistics data.
Attachment 1: Key superannuation coverage statistics, various Australian Bureau of Statistics surveys
Sunday, July 31, 2016


